Microservice Project
A disposable three-tier stack (Nginx, service layer, PostgreSQL) with Prometheus, Grafana, and Jaeger wired end-to-end, built to see how a system behaves rather than assume it.
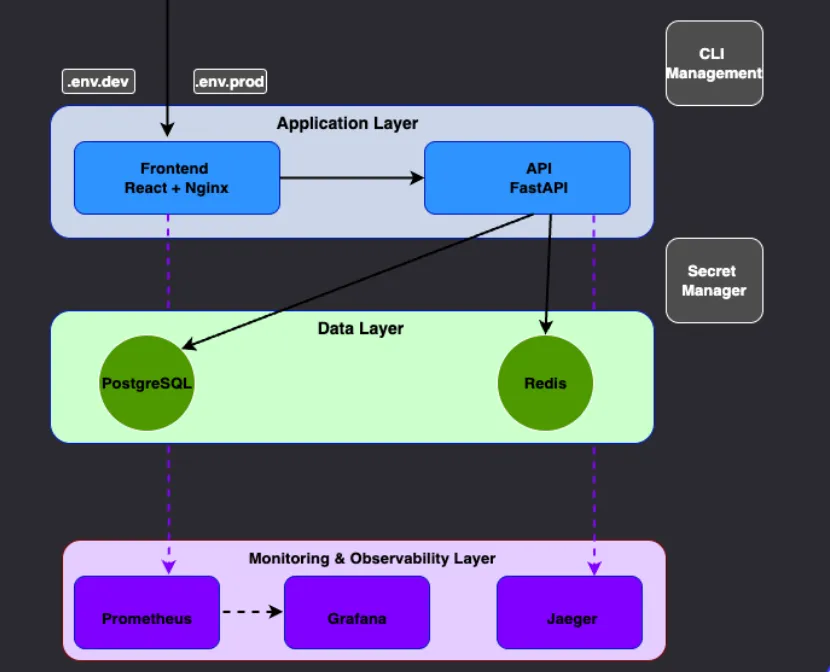
I wanted to understand what a three-tier system looks like from the inside. This means seeing not just how services talk to each other, but the traces, metrics, and logs that show why they are slow.
I built a small three-tier stack: Nginx in front, a service layer, and PostgreSQL underneath. I wired the full observability triangle too: Prometheus for metrics, Grafana for dashboards, and Jaeger for distributed traces. Everything comes up with one Docker Compose command so the whole thing is disposable and reproducible.
You can't reason about a system you can't see inside of.
A template I now reach for whenever I need to reason about how a system behaves rather than how I assume it does.
- Metrics, traces, and logs wired end-to-end across three tiers
- One-command bring-up via Docker Compose
- Jaeger traces requests through Nginx, service, and database