Building Resilience Through Chaos Engineering on AWS EKS
Chaos engineering practices using Chaos Mesh on Amazon EKS to build more resilient cloud-native applications
Chaos engineering practices using Chaos Mesh on Amazon EKS to build more resilient cloud-native applications.
System failures aren’t a matter of “if” but “when.” I learned this during a cascading failure that started with one innocent microservice update.
Your application might look bulletproof in staging, but production reveals dependencies you never knew existed. That “reporting-only” API your service calls? It’s in the critical path. The shared Redis cache? Everyone uses it. When one service slows down, everything downstream suffers.
What if you could hit these failures during office hours, coffee in hand, in a sandbox where you can’t nuke production? That’s chaos engineering done right.
Netflix pioneered this with Chaos Monkey, starting small and safe. We’re doing the same.
Chaos engineering proactively introduces controlled failures, instead of waiting for surprises, to:
• Find hidden weaknesses before they cause outages
• Build confidence in recovery procedures through practice
• Improve incident response by creating muscle memory for failure scenarios
When that database connection fails in production, your team won’t panic because they’ve handled it before.
Infrastructure as Code Approach
We’re using Terraform for everything: reproducible chaos environments you can spin up, experiment with, and tear down without leftover resources.
Lessons from Implementation
Building this took longer than expected, because of three decisions I got wrong initially.
Container Runtime Reality Check I assumed Docker everywhere. Amazon Linux 2023 uses containerd by default, and Chaos Mesh needs direct access to container runtime sockets. Check your runtime before installing chaos tools.
Spot Instances for Chaos Labs Spot instances seem risky for reliability testing, but they’re perfect: they can vanish at any moment, adding to the chaos. Plus, 90% cost savings means running extensive experiments without the bills.
For production chaos testing, stick with on-demand instances. Having AWS reclaim your Spot capacity mid-experiment defeats the purpose.
IRSA for Secure Experiments Skip embedded credentials entirely. IAM Roles for Service Accounts (IRSA) gives fine-grained control over which AWS resources experiments can access. This is essential when experiments need CloudWatch or AWS API access.
Demo Application Architecture
Instead of a toy single-service app, we need something that breaks in interesting ways: a three-tier system mirroring microservices pain points.
Each tier fails differently and teaches something specific:
Frontend Two nginx replicas, not more, not less. This gives basic high availability while showing load distribution effects during failures. When backend services slow down, nginx timeout configs become critical. If they are too short, users see errors. If they are too long, the user experience suffers.
This is where user pain shows up first. Kill backend pods or add network delays, and the frontend reveals whether your system fails gracefully or passes errors straight through.
Backend API Three Apache httpd replicas create interesting scenarios. Kill one and you still have 66% capacity, mirroring production where some capacity dies but service continues.
httpd might seem old-school for a modern API, but it’s perfect for predictable chaos experiments: easy to configure response times, simulate load patterns, and test service discovery. In production, these would be your actual API services.
Database Single Redis instance. Yes, this violates every production best practice. A single point of failure creates cascading scenarios that reveal how your application handles data layer problems.
When we network-partition this database, both frontend and backend must gracefully handle data access failures. Does your service degrade gracefully, or crash? This design forces proper connection pooling, retry logic, and graceful degradation.
Chaos Engineering Experiments
We’re not randomly breaking things. Each experiment targets specific failure modes you’ll see in production. Start simple, build confidence, then move to complex scenarios.
Technical Stack
- Infrastructure: AWS EKS, Terraform
- Chaos Platform: Chaos Mesh
- Container Runtime: containerd
- Monitoring: kubectl, curl, custom scripts
- Languages: YAML, Bash, HCL
Prerequisites
- EKS cluster (1.30-1.31) with containerd runtime
- kubectl configured
- Helm 3.8+ installed
- AWS CLI configured with appropriate IAM permissions
Important: EKS uses containerd at
/run/containerd/containerd.sockby default. This socket path is critical for Chaos Mesh daemon operations.
Quick Setup
1. Deploy Infrastructure
Either option works:
Quick Cluster with eksctl:
# Create an EKS cluster with containerd (check supported versions: aws eks describe-addon-versions)
eksctl create cluster \
  --name chaos-engineering-lab \
  --version 1.31 \
  --region us-east-1 \
  --nodegroup-name chaos-workers \
  --node-type t3.medium \
  --nodes 3 \
  --nodes-min 2 \
  --nodes-max 4 \
  --managed \
  --spot \
  --node-ami-family AmazonLinux2023  # Pin AL2023 for containerd

# Note: Verify EKS version support before creating cluster
# aws eks describe-addon-versions --kubernetes-version 1.31
Using Terraform:
git clone  https://github.com/ToluGIT/chaos-mesh-eks.git
cd terraform/
terraform init && terraform apply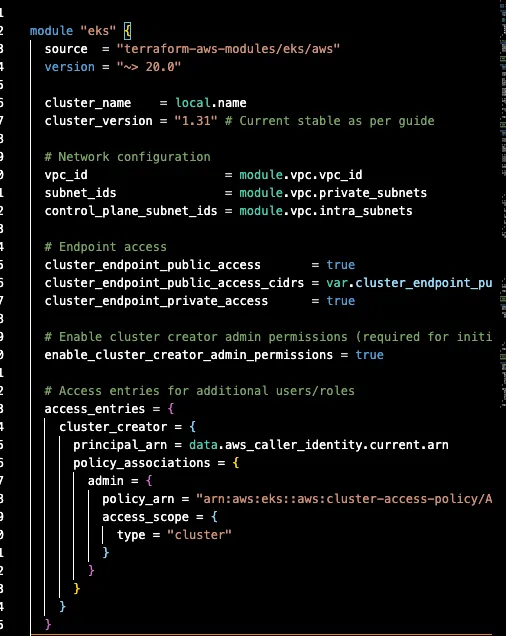

Connect to Your Cluster:
# Update kubeconfig
aws eks update-kubeconfig --region us-east-1 --name chaos-engineering-lab

# Verify you're connected
kubectl get nodes

# Check the containerd socket path (this is important!)
kubectl get nodes -o wide
# Note: EKS nodes use containerd at /run/containerd/containerd.sock
2. Create Isolated Sandbox Environment
First, create an isolated sandbox for the chaos experiments:
# Create the chaos-sandbox namespace for our test applications
kubectl create namespace chaos-sandbox

# Label it clearly so everyone knows what it's for
kubectl label namespace chaos-sandbox purpose=chaos-experiments
kubectl label namespace chaos-sandbox environment=sandbox
kubectl annotate namespace chaos-sandbox chaos-mesh.org/inject=enabled
3. Install Chaos Mesh with Security Controls
# Create the chaos-mesh namespace for the chaos infrastructure
kubectl create namespace chaos-mesh

# Install Chaos Mesh with containerd configuration (pin version for reproducibility)
helm repo add chaos-mesh https://charts.chaos-mesh.org
helm repo update
helm install chaos-mesh chaos-mesh/chaos-mesh \
  --namespace chaos-mesh \
  --version 2.7.3 \
  --set chaosDaemon.runtime=containerd \
  --set chaosDaemon.socketPath=/run/containerd/containerd.sock \
  --set controllerManager.enableFilterNamespace=true \
  --set controllerManager.targetNamespace=chaos-sandbox

# Note: Check latest compatible versions at https://artifacthub.io/packages/helm/chaos-mesh/chaos-mesh
# Chaos Mesh 2.7.x supports Kubernetes 1.25-1.31

# Verify installation
kubectl get pods -n chaos-mesh -w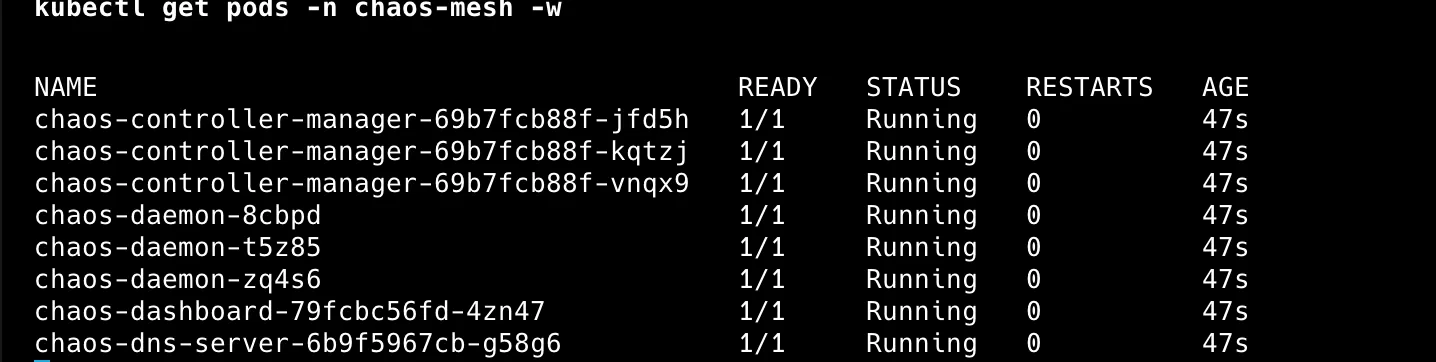
4. Implement Namespace Safety Fence (Curated RBAC)
This centralizes chaos experiments in chaos-mesh while limiting impact to chaos-sandbox only.
# Ensure the sandbox namespace exists
kubectl get namespace chaos-sandbox || kubectl create namespace chaos-sandbox

# Create the service account used for dashboard auth and API calls
kubectl create serviceaccount chaos-manager -n chaos-sandbox

# Apply curated RBAC
kubectl apply -f rbac/chaos-manager-cluster-role.yaml
kubectl apply -f rbac/chaos-sandbox-manager-role.yaml
kubectl apply -f rbac/chaos-rbac-bindings.yaml

# Generate a limited-scope token (2 hours duration)
kubectl create token chaos-manager -n chaos-sandbox --duration=2h
Note: Chaos Mesh runs in the chaos-mesh namespace (control plane), but RBAC and the target namespace filter limit experiments to chaos-sandbox workloads only.
This ensures that:
• Chaos CRs are created/read in chaos-mesh, but selectors limit actions to chaos-sandbox
• The service account has write only in chaos-sandbox and read-only elsewhere
• The dashboard has minimum visibility without cluster-admin
5. Deploy Test Application to Sandbox
# Deploy our multi-tier application to the chaos-sandbox namespace
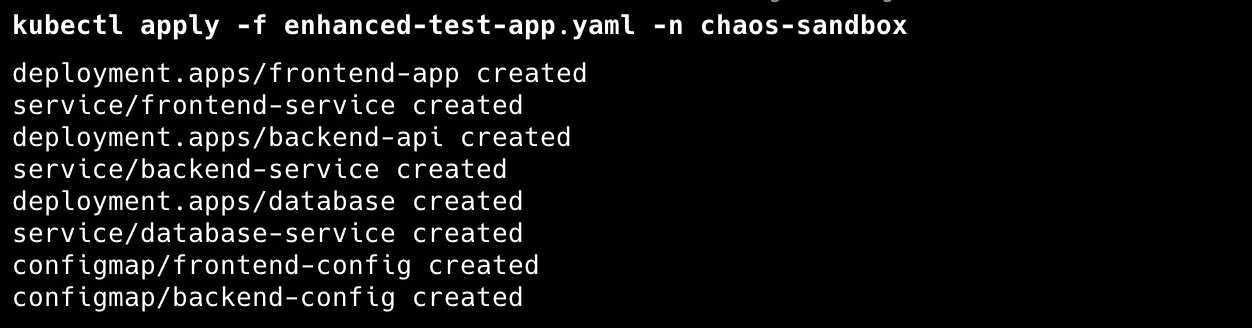
kubectl apply -f enhanced-test-app.yaml -n chaos-sandbox

# Verify deployment
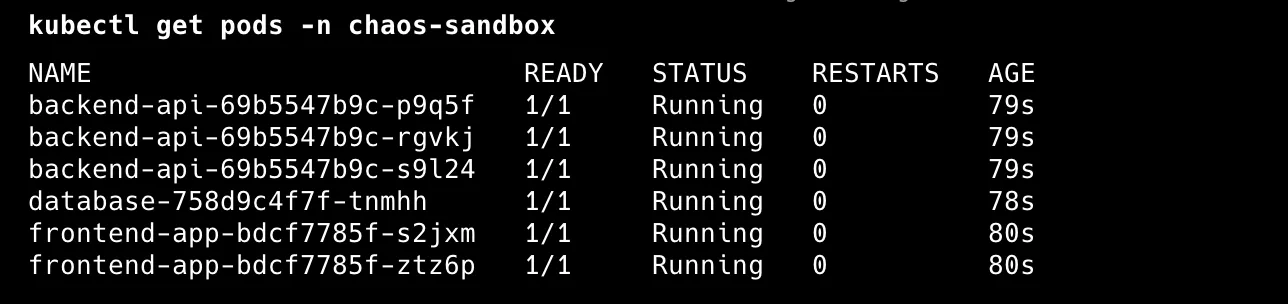
kubectl get pods -n chaos-sandbox
kubectl get services -n chaos-sandbox
6. Set Up Dashboard Access with Limited Permissions
# Forward the Chaos Mesh dashboard
kubectl port-forward -n chaos-mesh svc/chaos-dashboard 2333:2333
# Access at http://localhost:2333
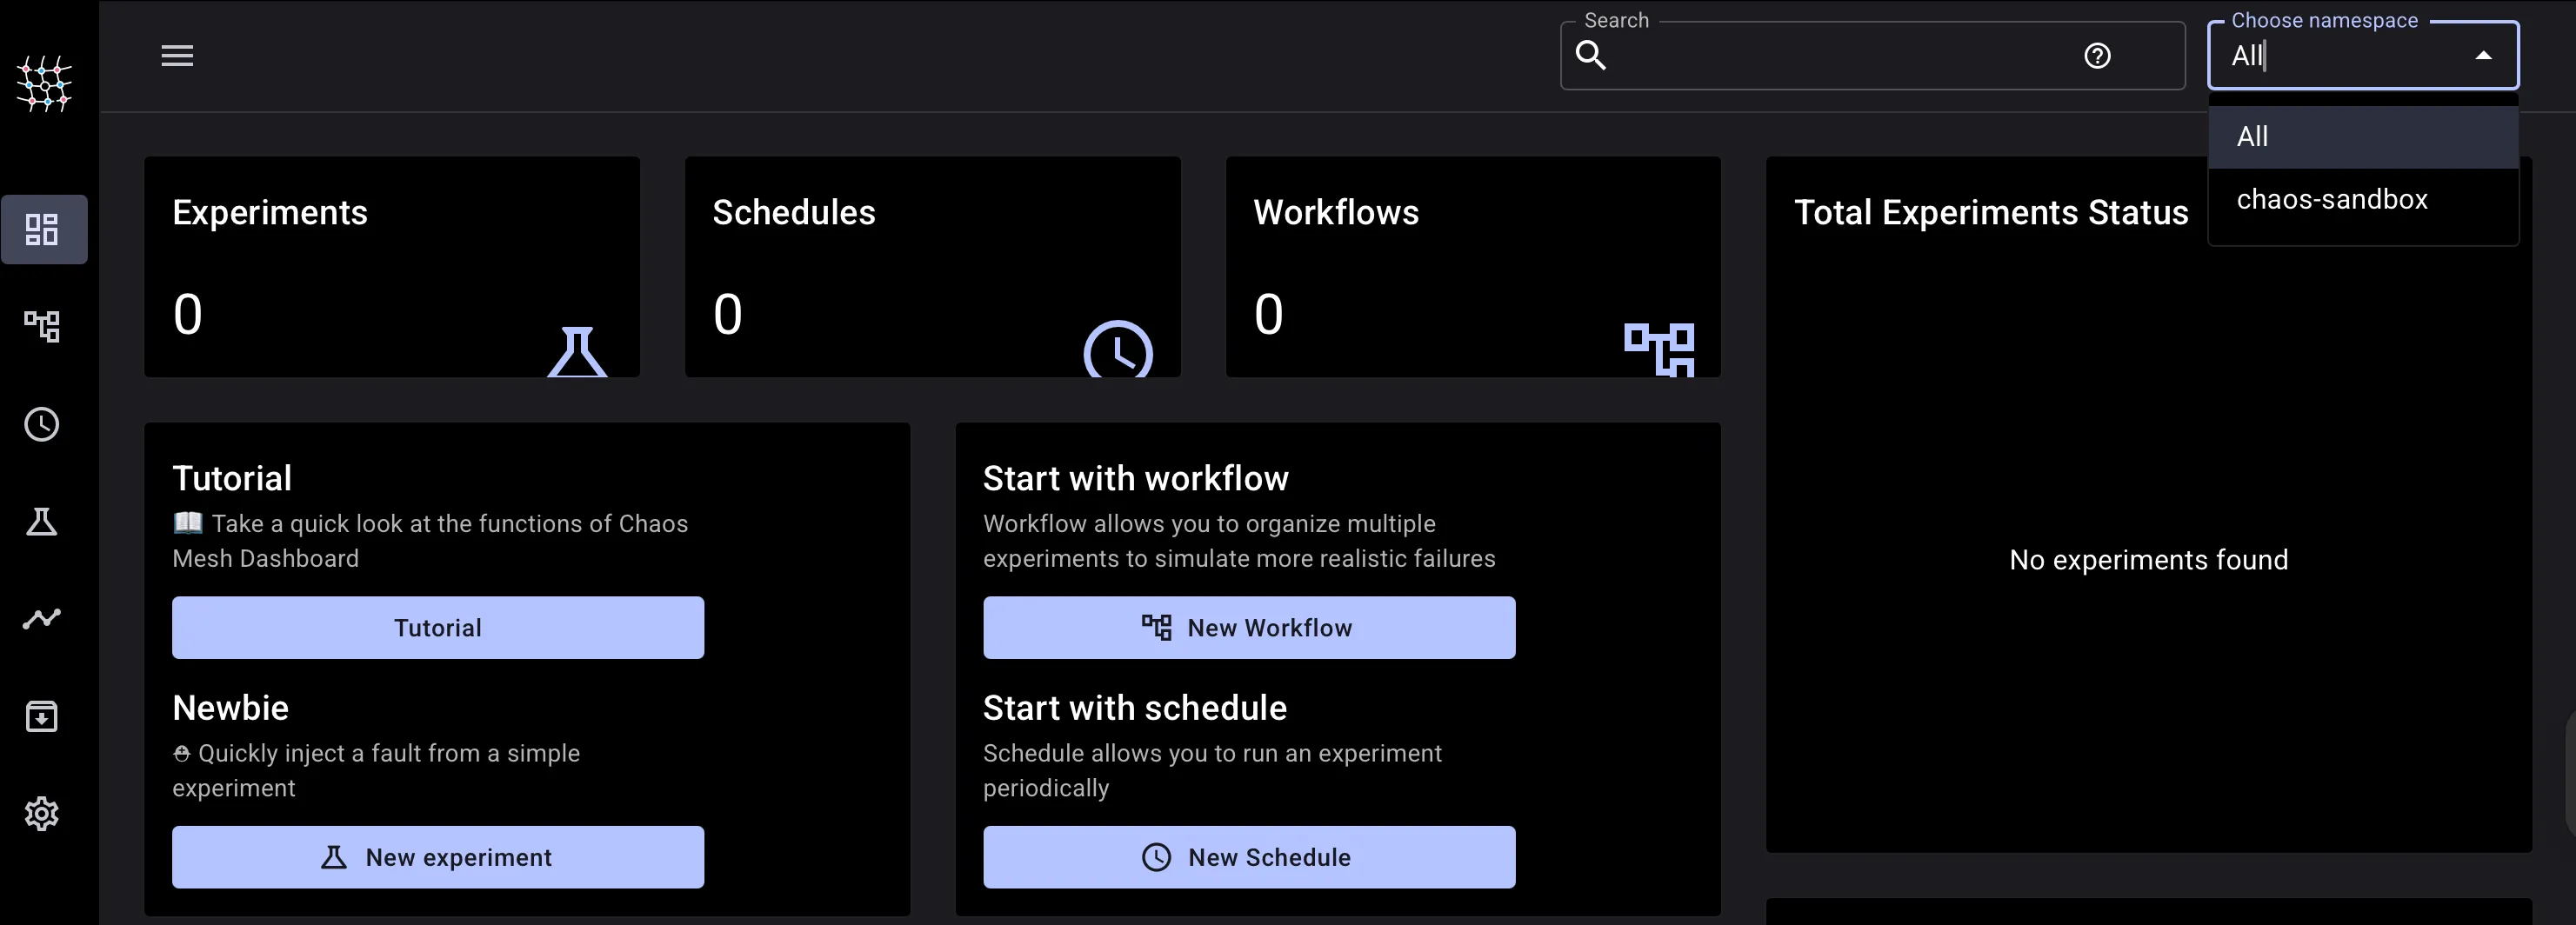
Visit http://localhost:2333 and use the limited-scope token for ServiceAccount chaos-manager from step 4. The dashboard shows you can only create experiments targeting the chaos-sandbox namespace, the safety fence in action.
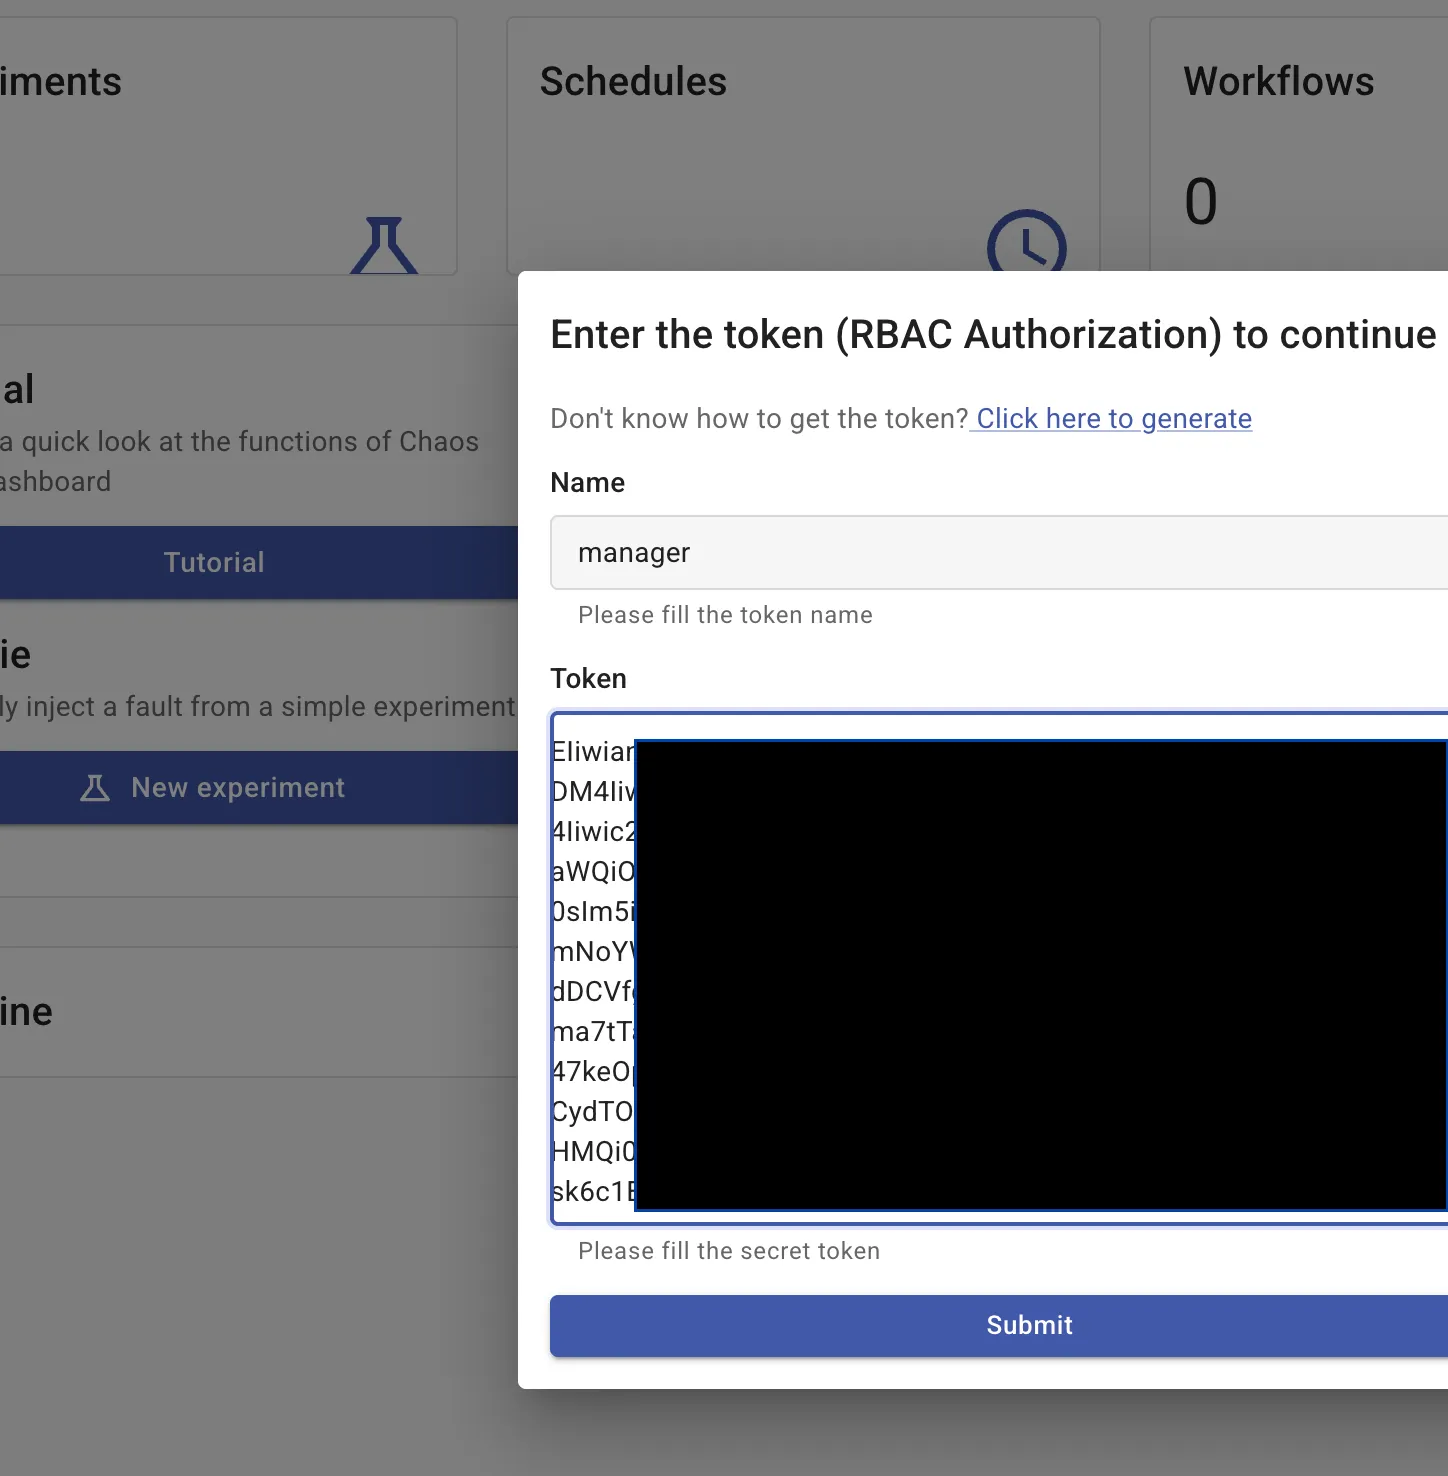
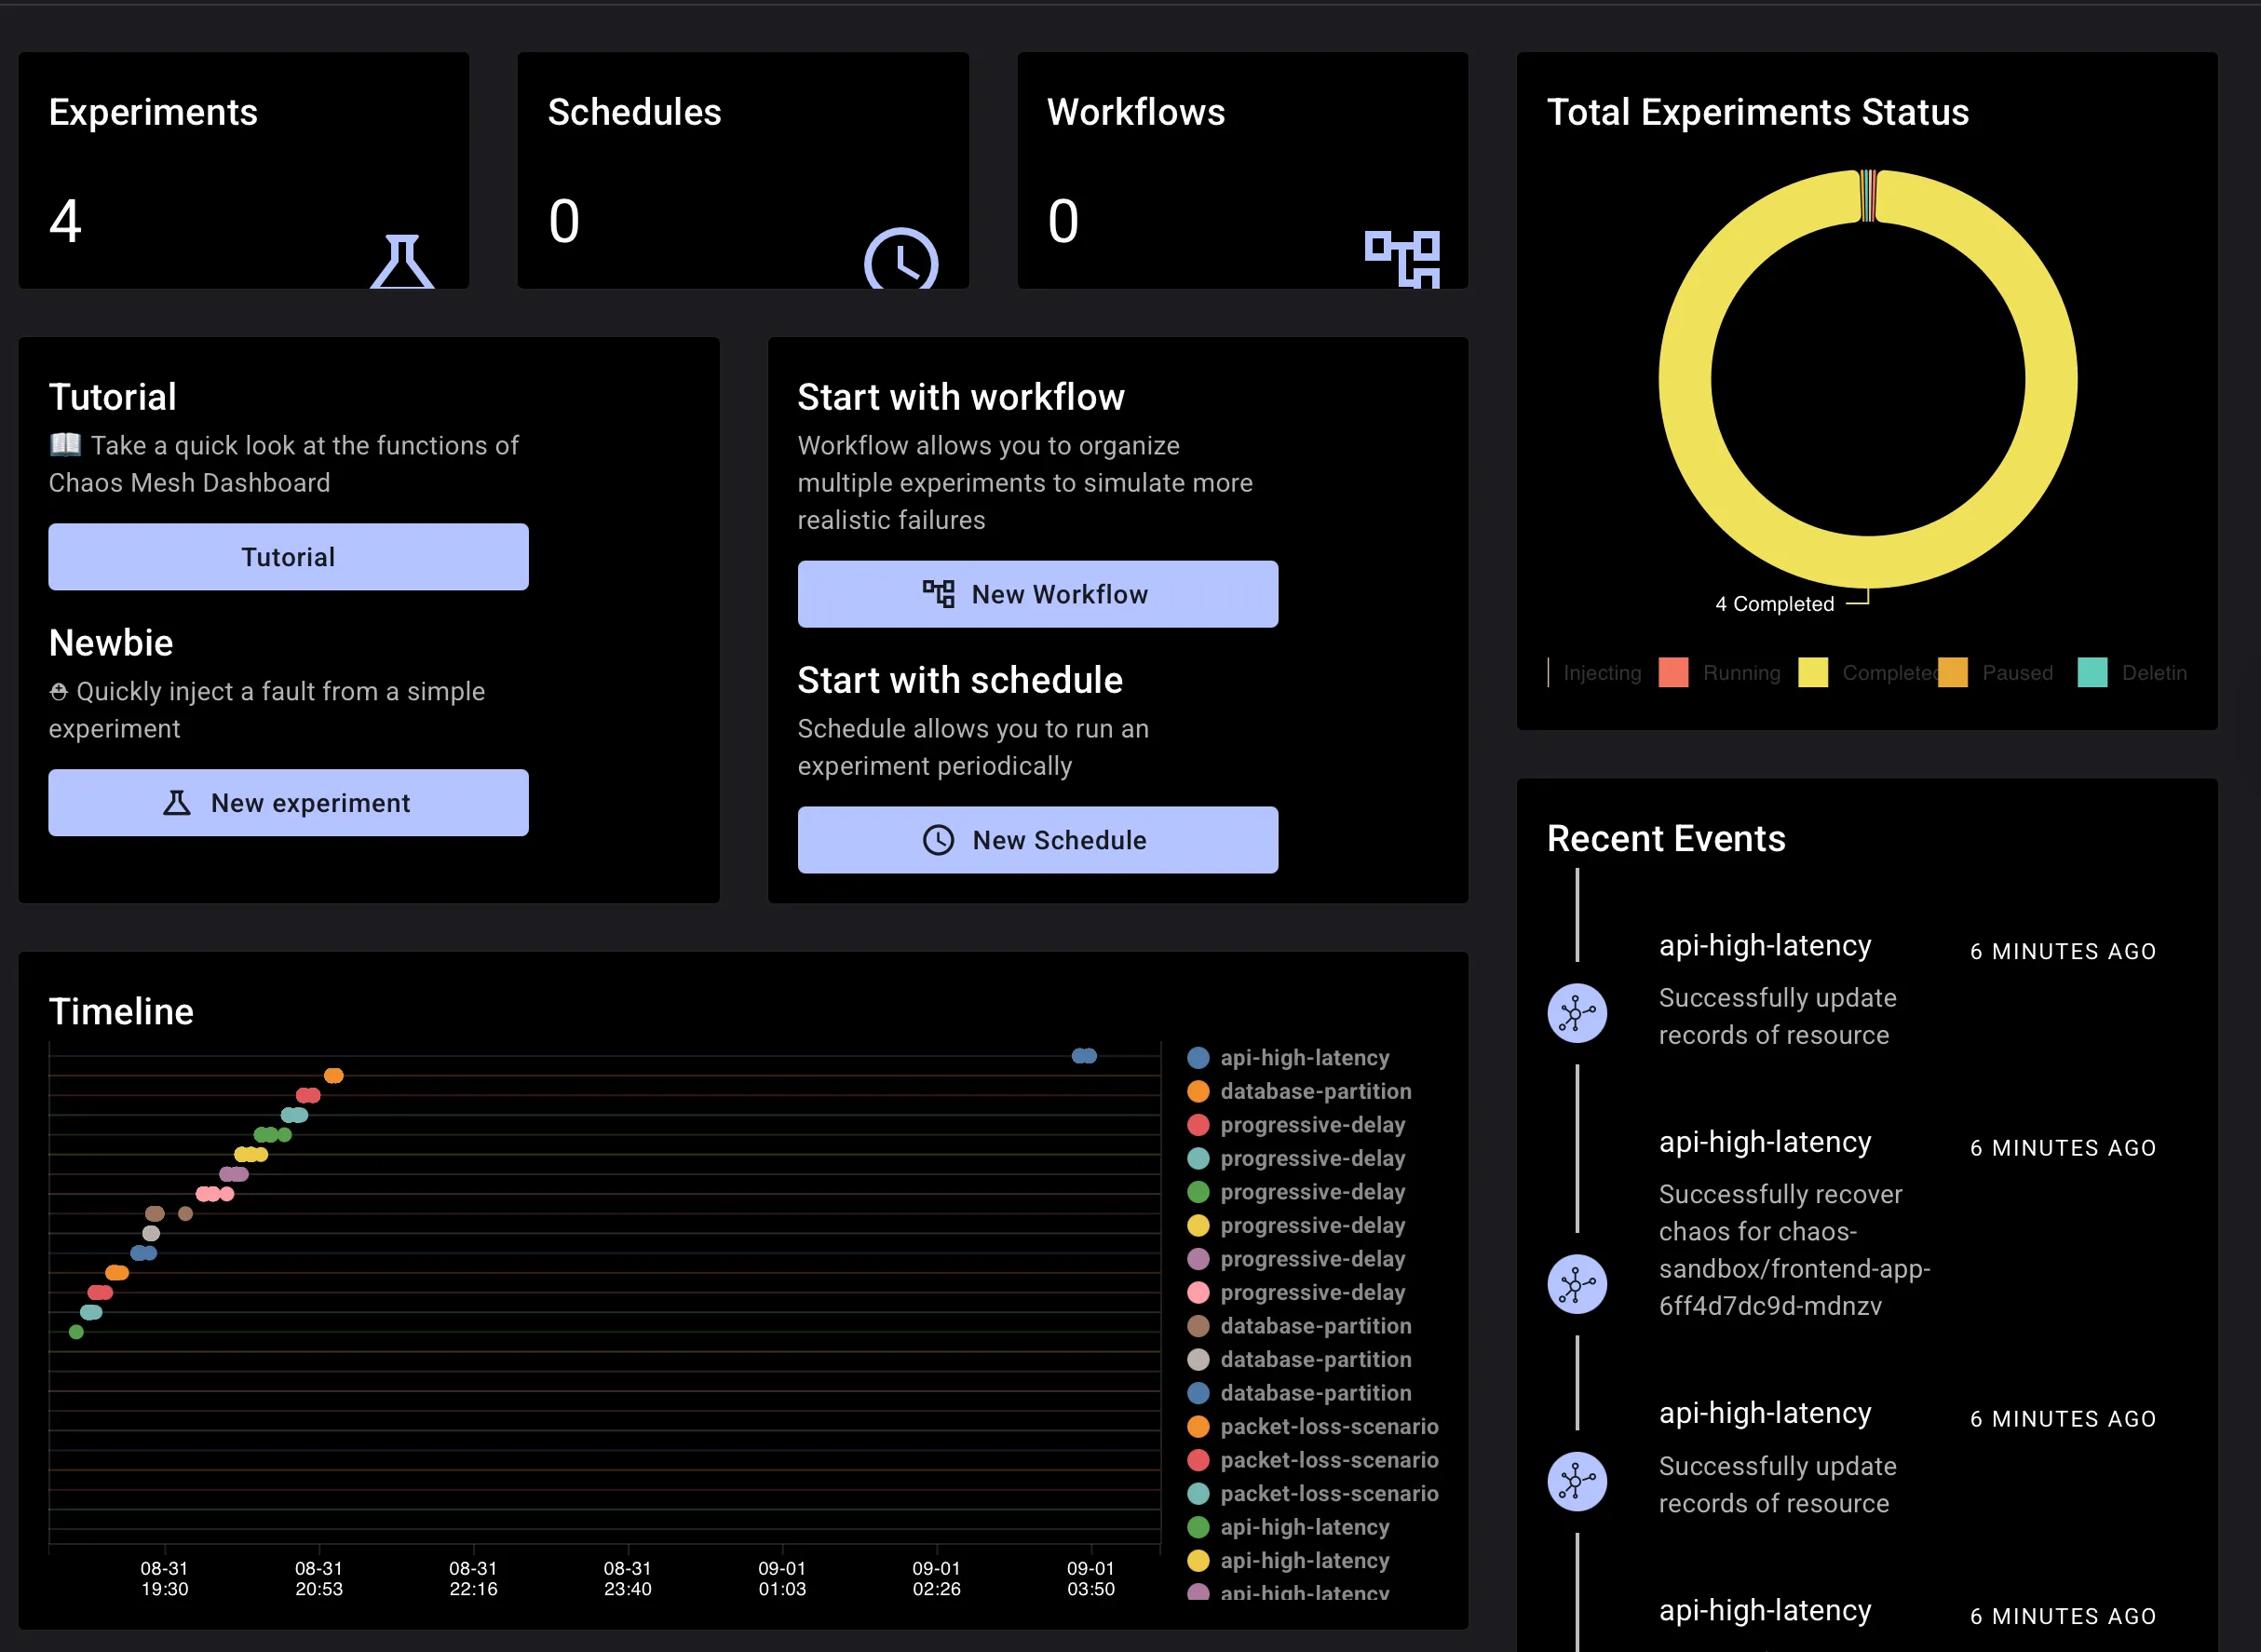
The dashboard provides visual experiment management with:
• Point-and-click experiment creation
• Experiment monitoring
• Historical experiment analysis
Monitoring & Observability
Enable Container Insights in CloudWatch before running experiments. You need baseline metrics to know what “normal” looks like versus “chaos.”
Container Insights Metrics:
• CPU Usage: pod_cpu_utilization - spikes when pods restart after kills
• Memory Usage: pod_memory_utilization - pressure during resource exhaustion
• Pod Restarts: pod_number_of_container_restarts - tracks chaos experiment impact
• Node Resources: node_cpu_utilization, node_memory_utilization - cluster health
Application Response Times (via ALB/CloudWatch):
• ALB Response Time: AWS/ApplicationELB/TargetResponseTime - user-facing latency
• ALB Request Count: AWS/ApplicationELB/RequestCount - traffic patterns during failures
Sample CloudWatch Insights Query:
fields @timestamp, pod_name, pod_cpu_utilization, pod_memory_utilization
| filter namespace_name = "chaos-sandbox"
| stats avg(pod_cpu_utilization), max(pod_memory_utilization) by pod_name
| sort @timestamp desc
Set alarms to auto-stop experiments if error rates hit dangerous levels. Chaos should teach, not break production.
Deploy the test application:
1. Pod Failure Testing
Start here. Pod failures happen constantly in production: during deployments, node maintenance, or container crashes. This experiment is predictable, showing instantly whether your application handles pod loss gracefully or passes errors to users.
API Version Note: All experiments use
chaos-mesh.org/v1alpha1API version, compatible with Chaos Mesh 2.6+ and Kubernetes 1.25-1.31.
apiVersion: chaos-mesh.org/v1alpha1
kind: PodChaos
metadata:
  name: basic-pod-kill
  namespace: chaos-mesh
  annotations:
    chaos.alpha.kubernetes.io/experiment: "pod-resilience-test"
spec:
  action: pod-kill
  mode: one                     # Kill only one pod at a time
  duration: "60s"               # Run for 1 minute to observe recovery
  selector:
    namespaces:
      - chaos-sandbox
    labelSelectors:
      app: backend-api           # Target our backend services
  # The killed pod should be recreated automatically by the Deployment
Chaos Mesh offers multiple ways to start an experiment. Here we use the dashboard, adding a YAML file directly.
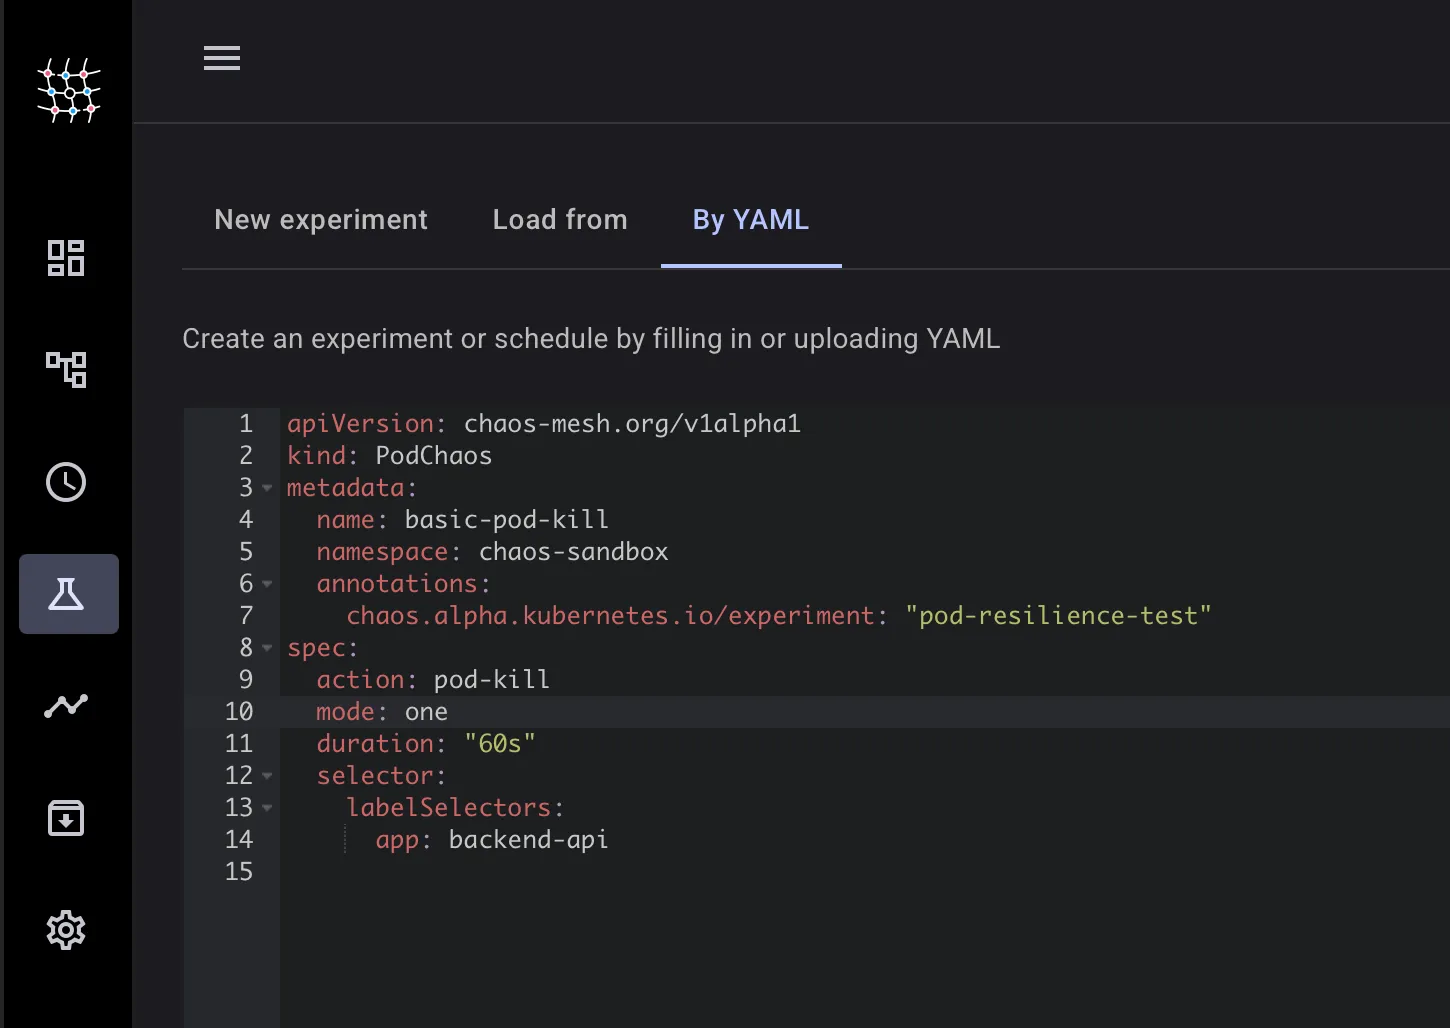
It auto-populates the experiment sections from the YAML manifest.
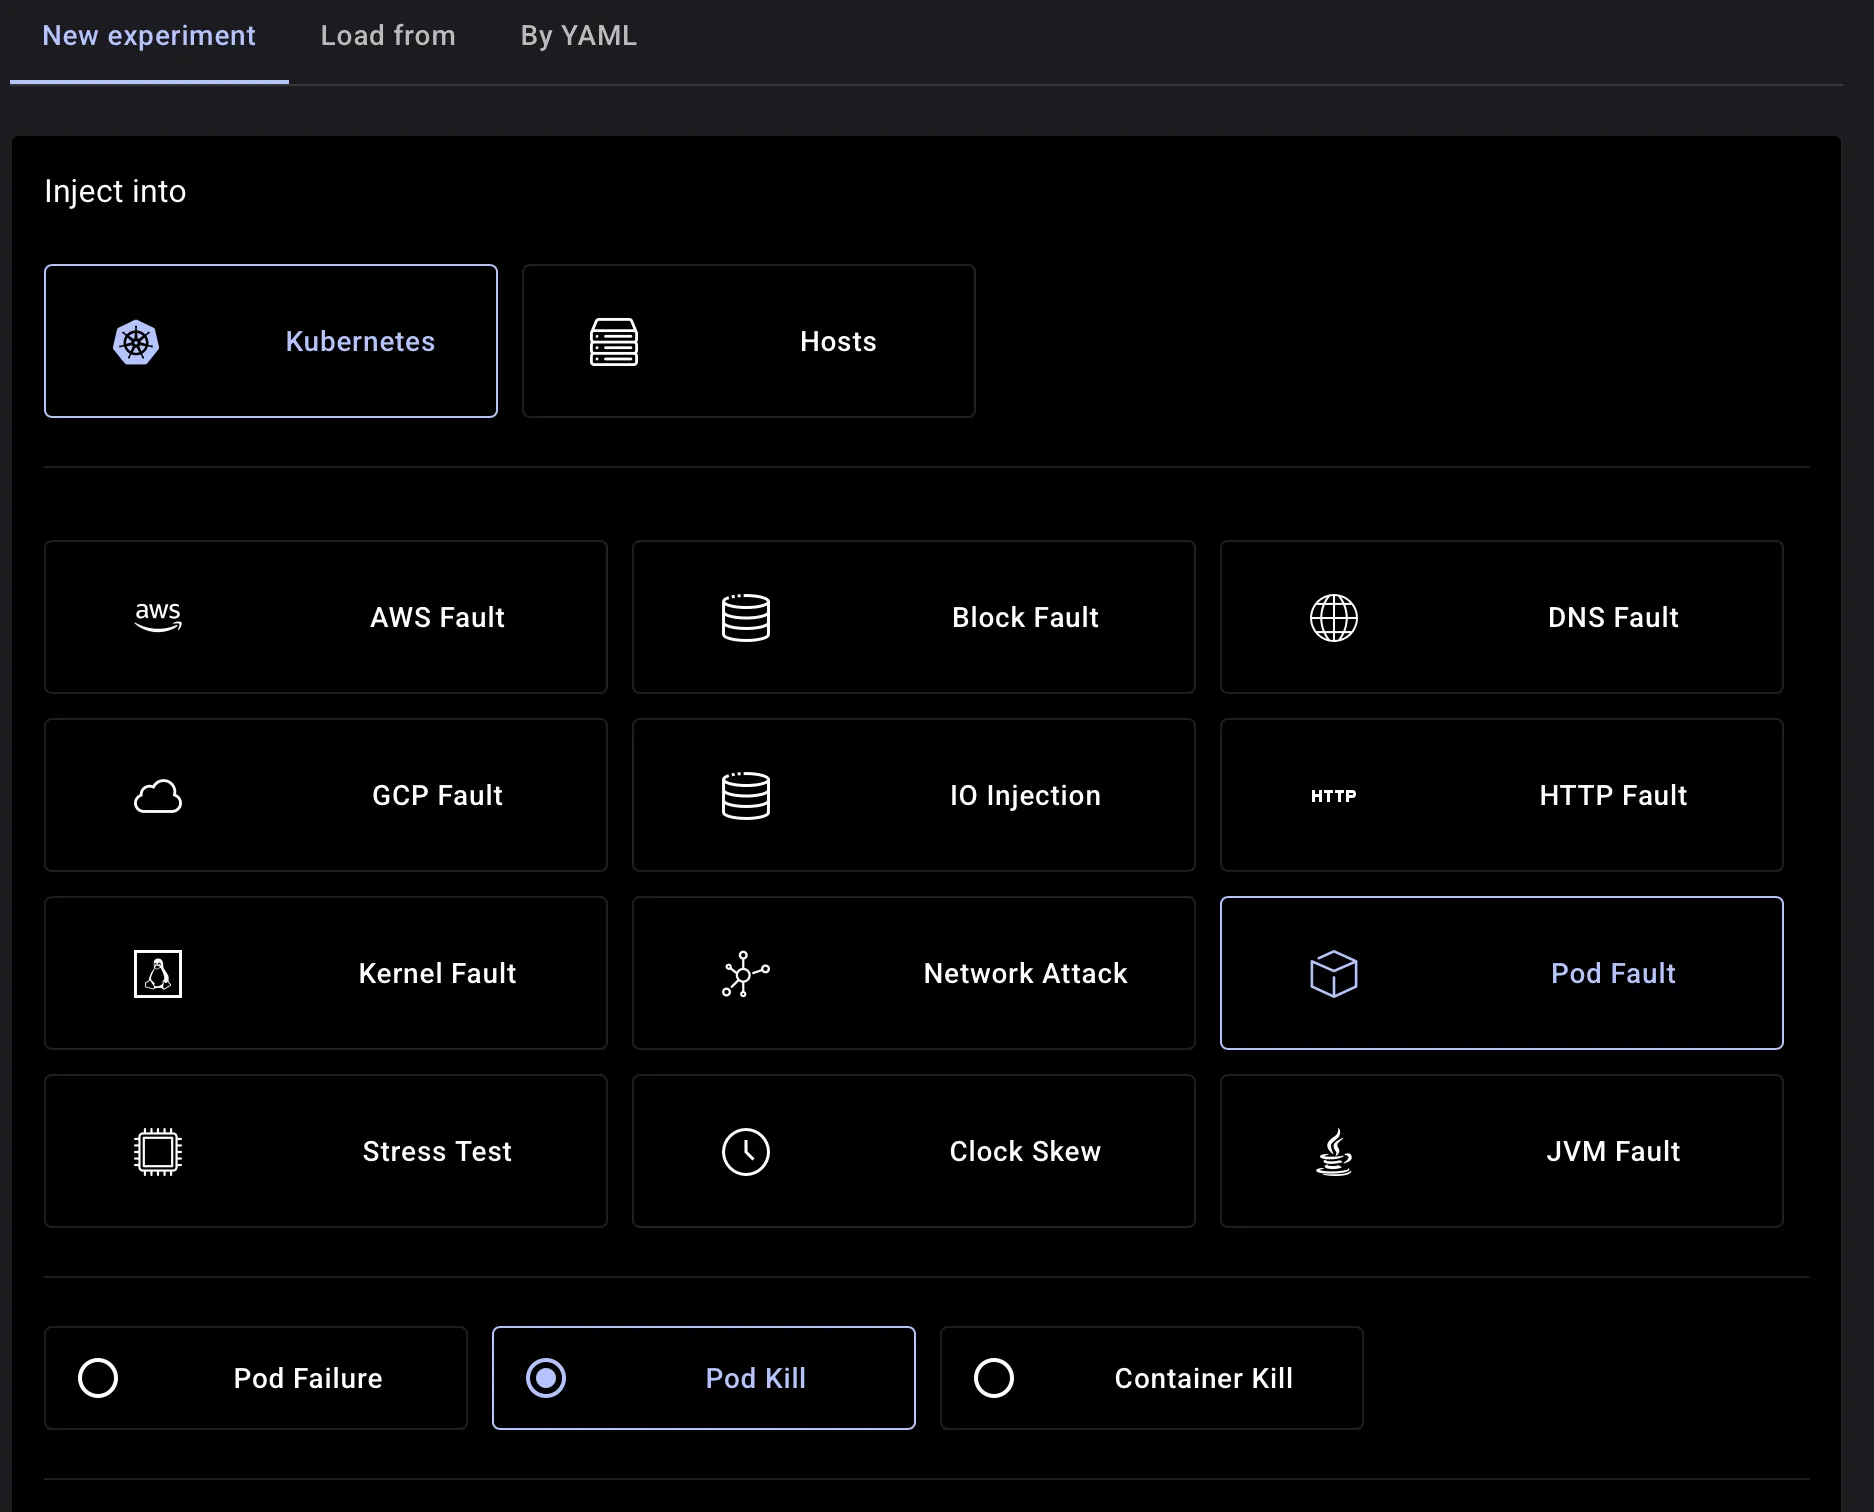
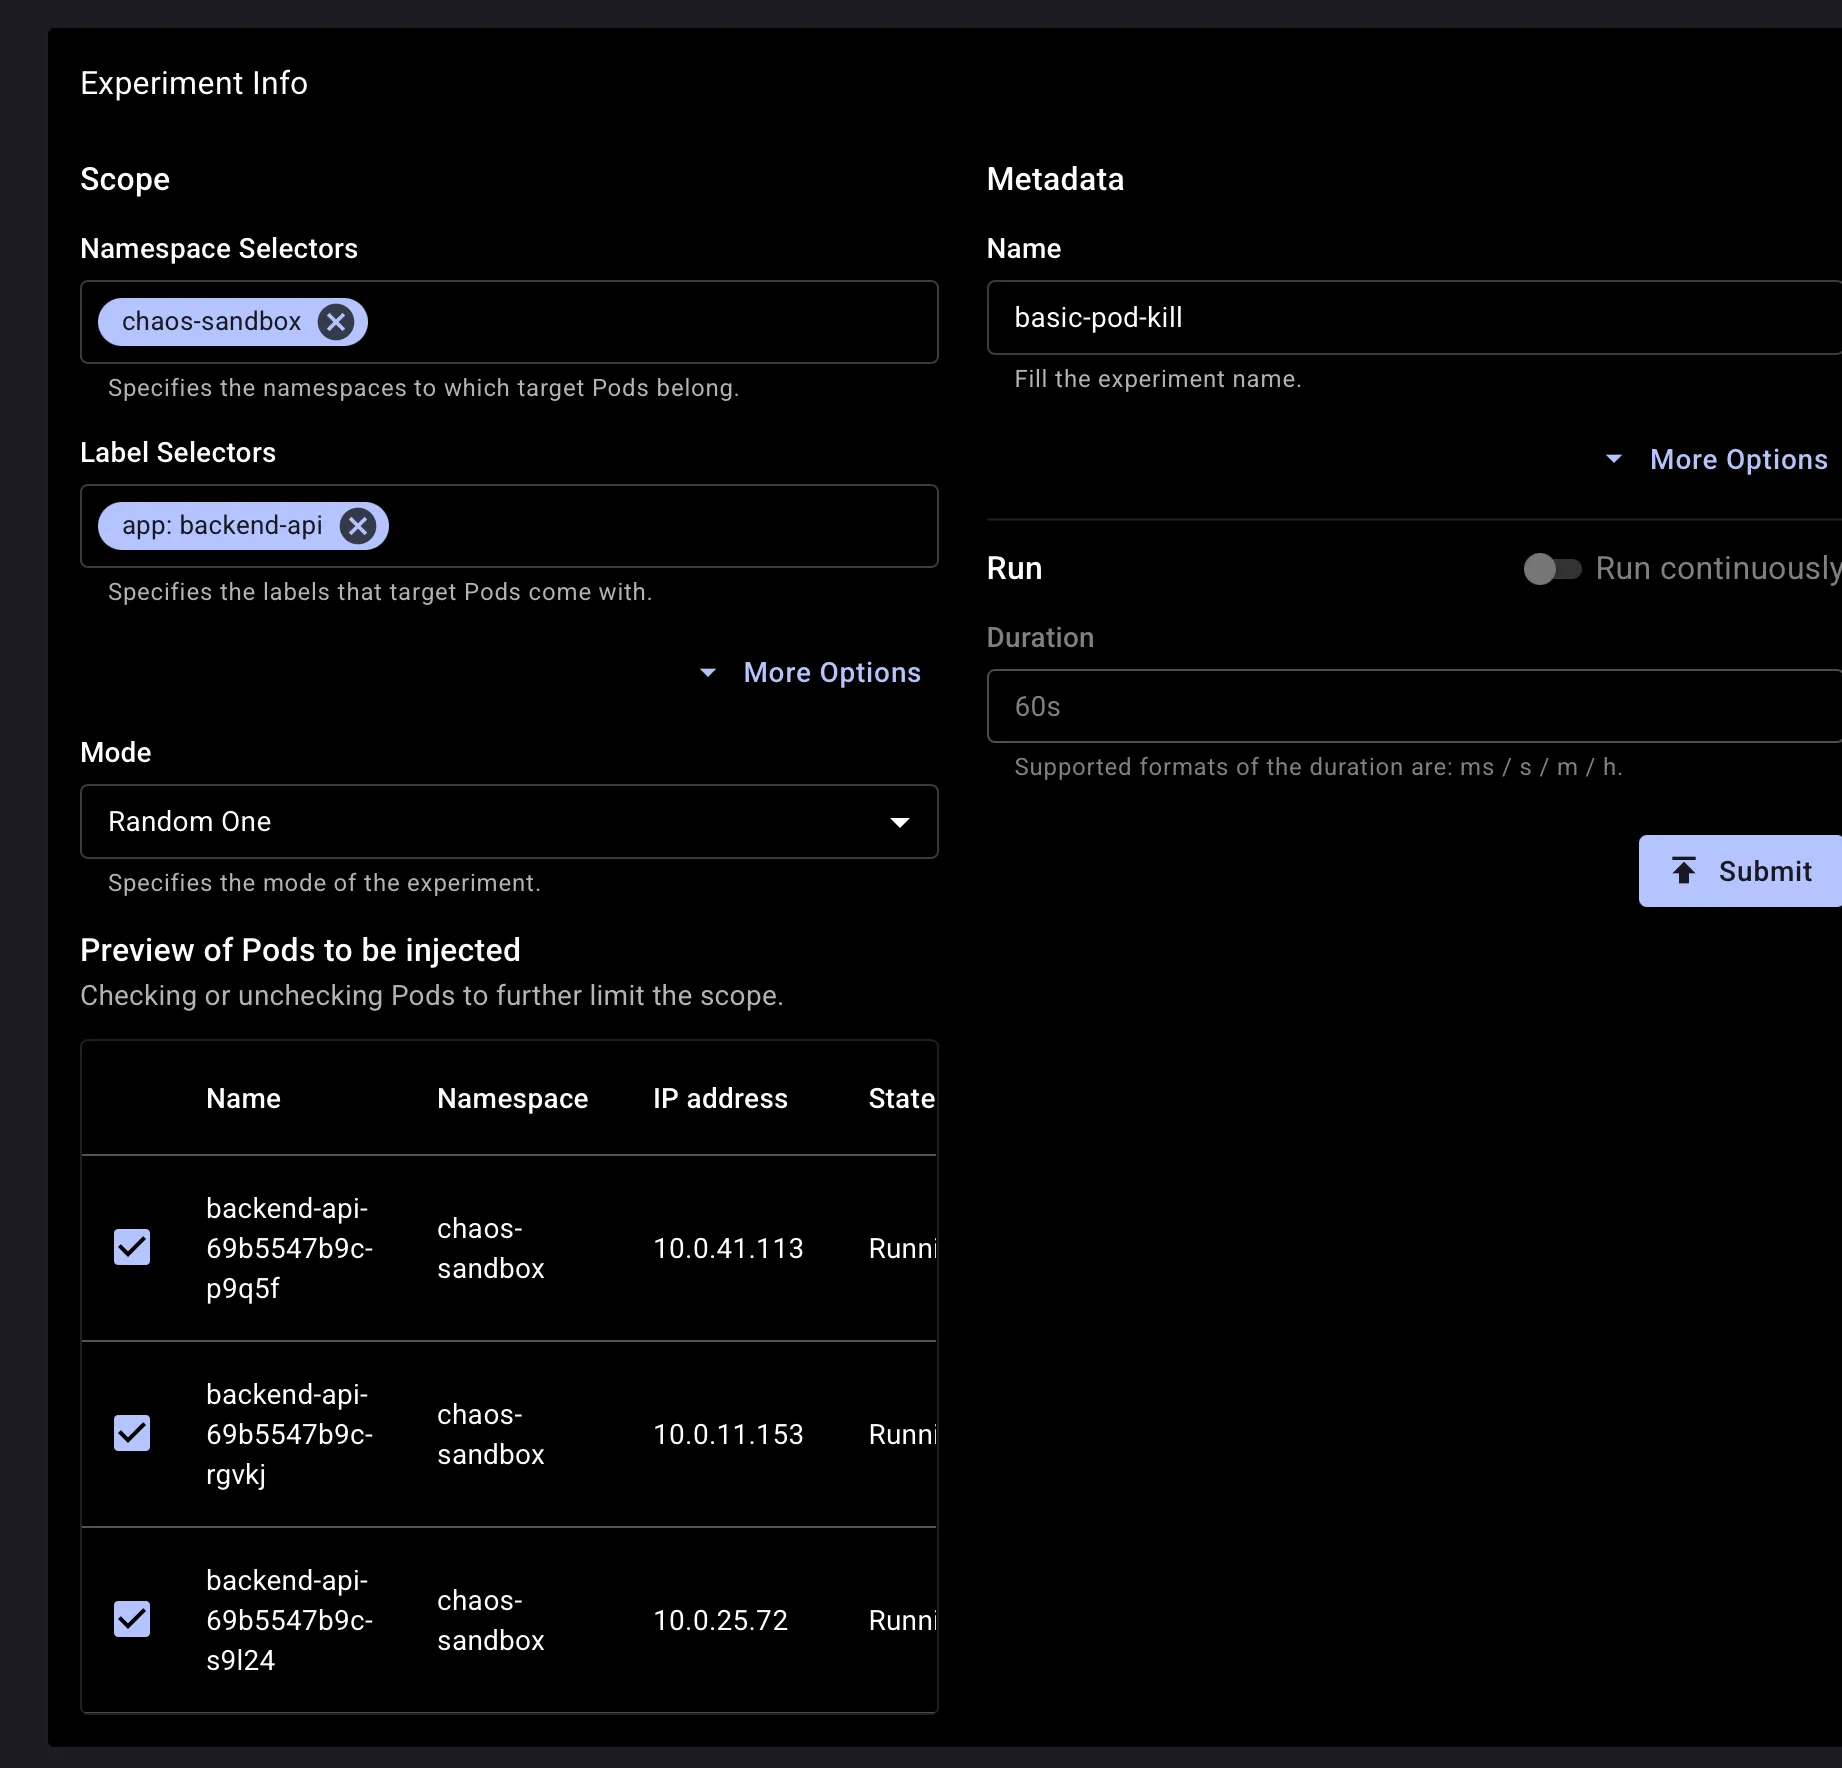
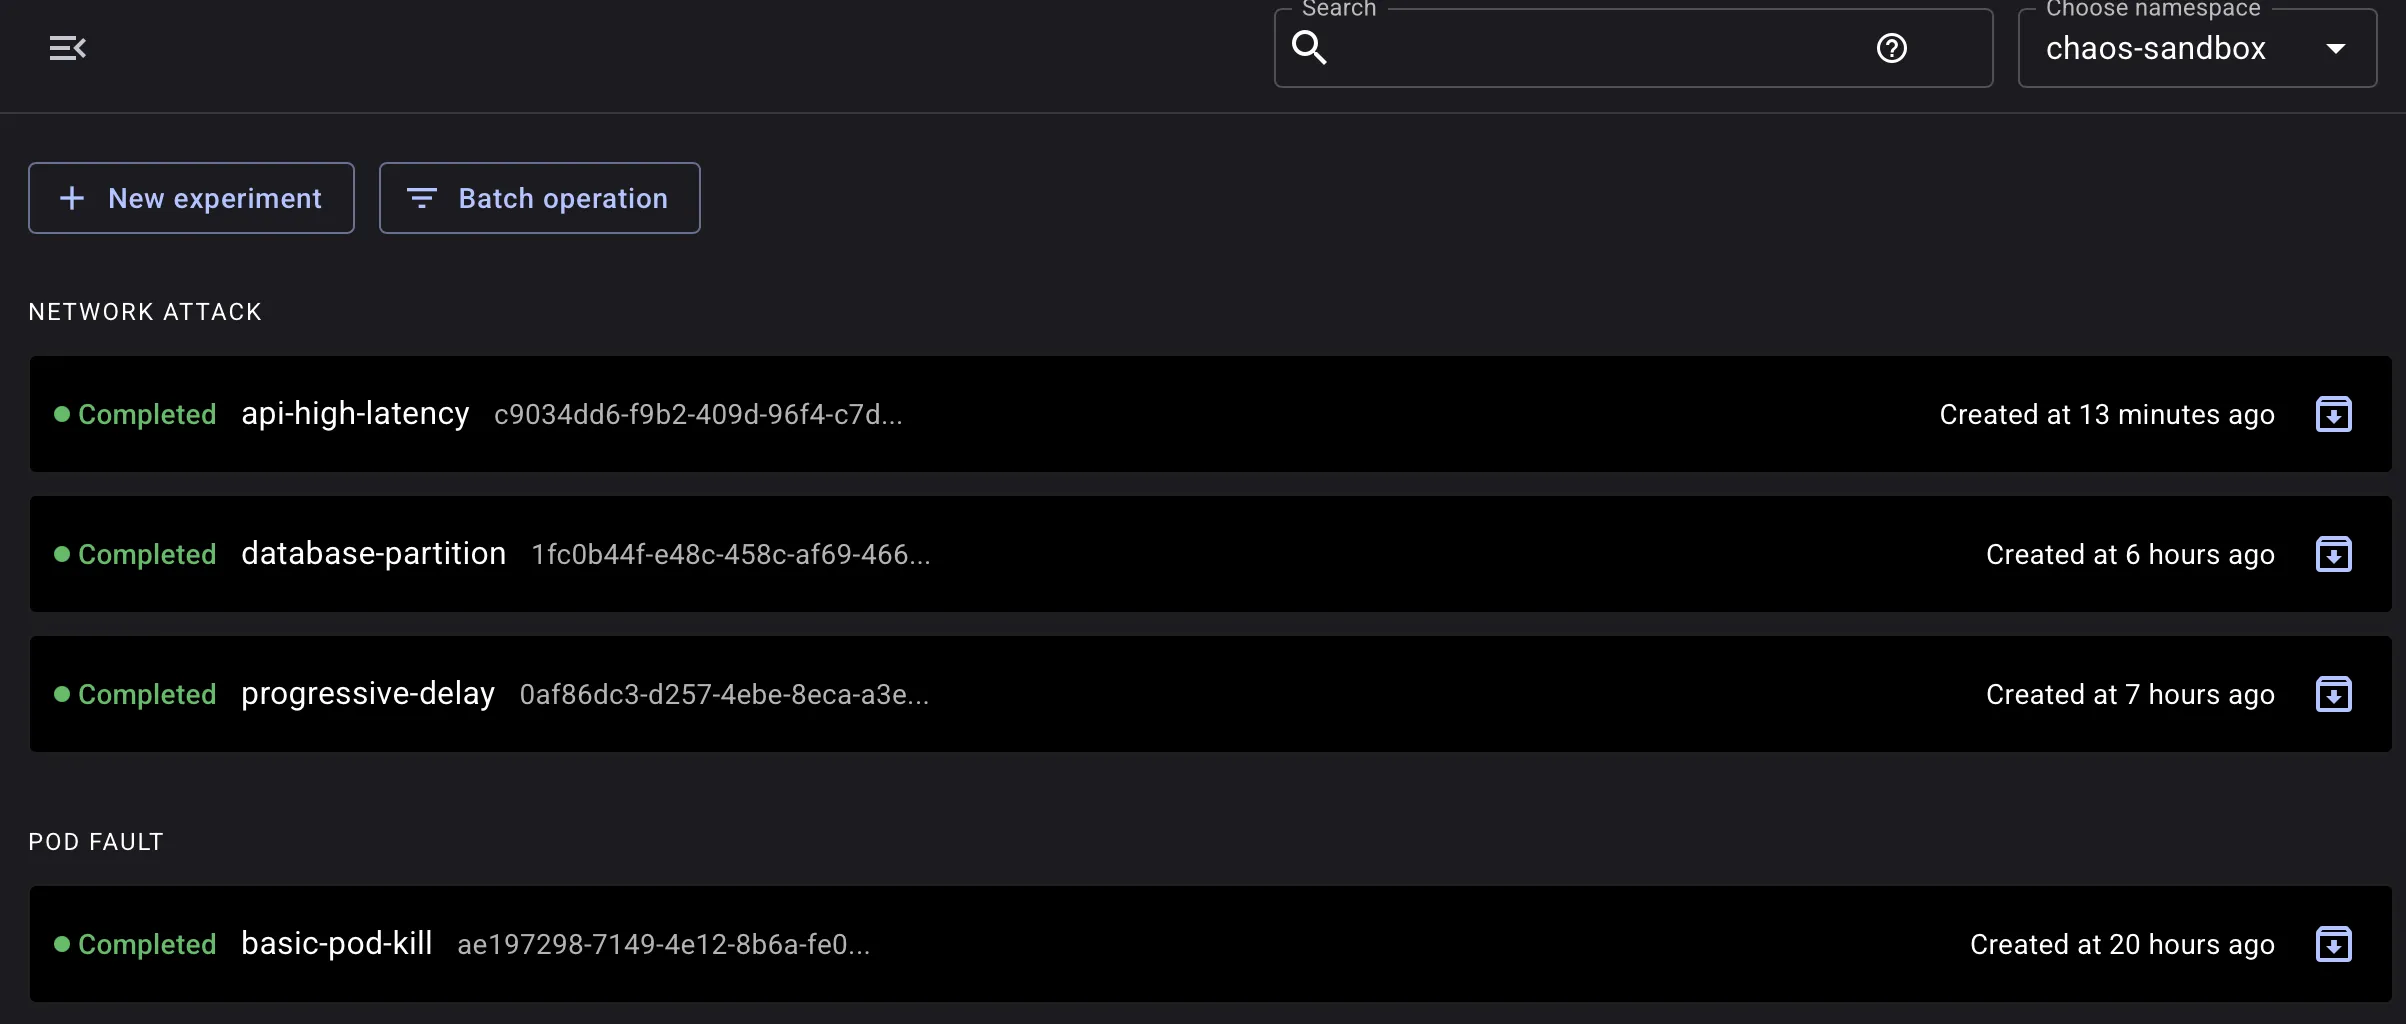
After submitting, monitor progress directly in the dashboard:
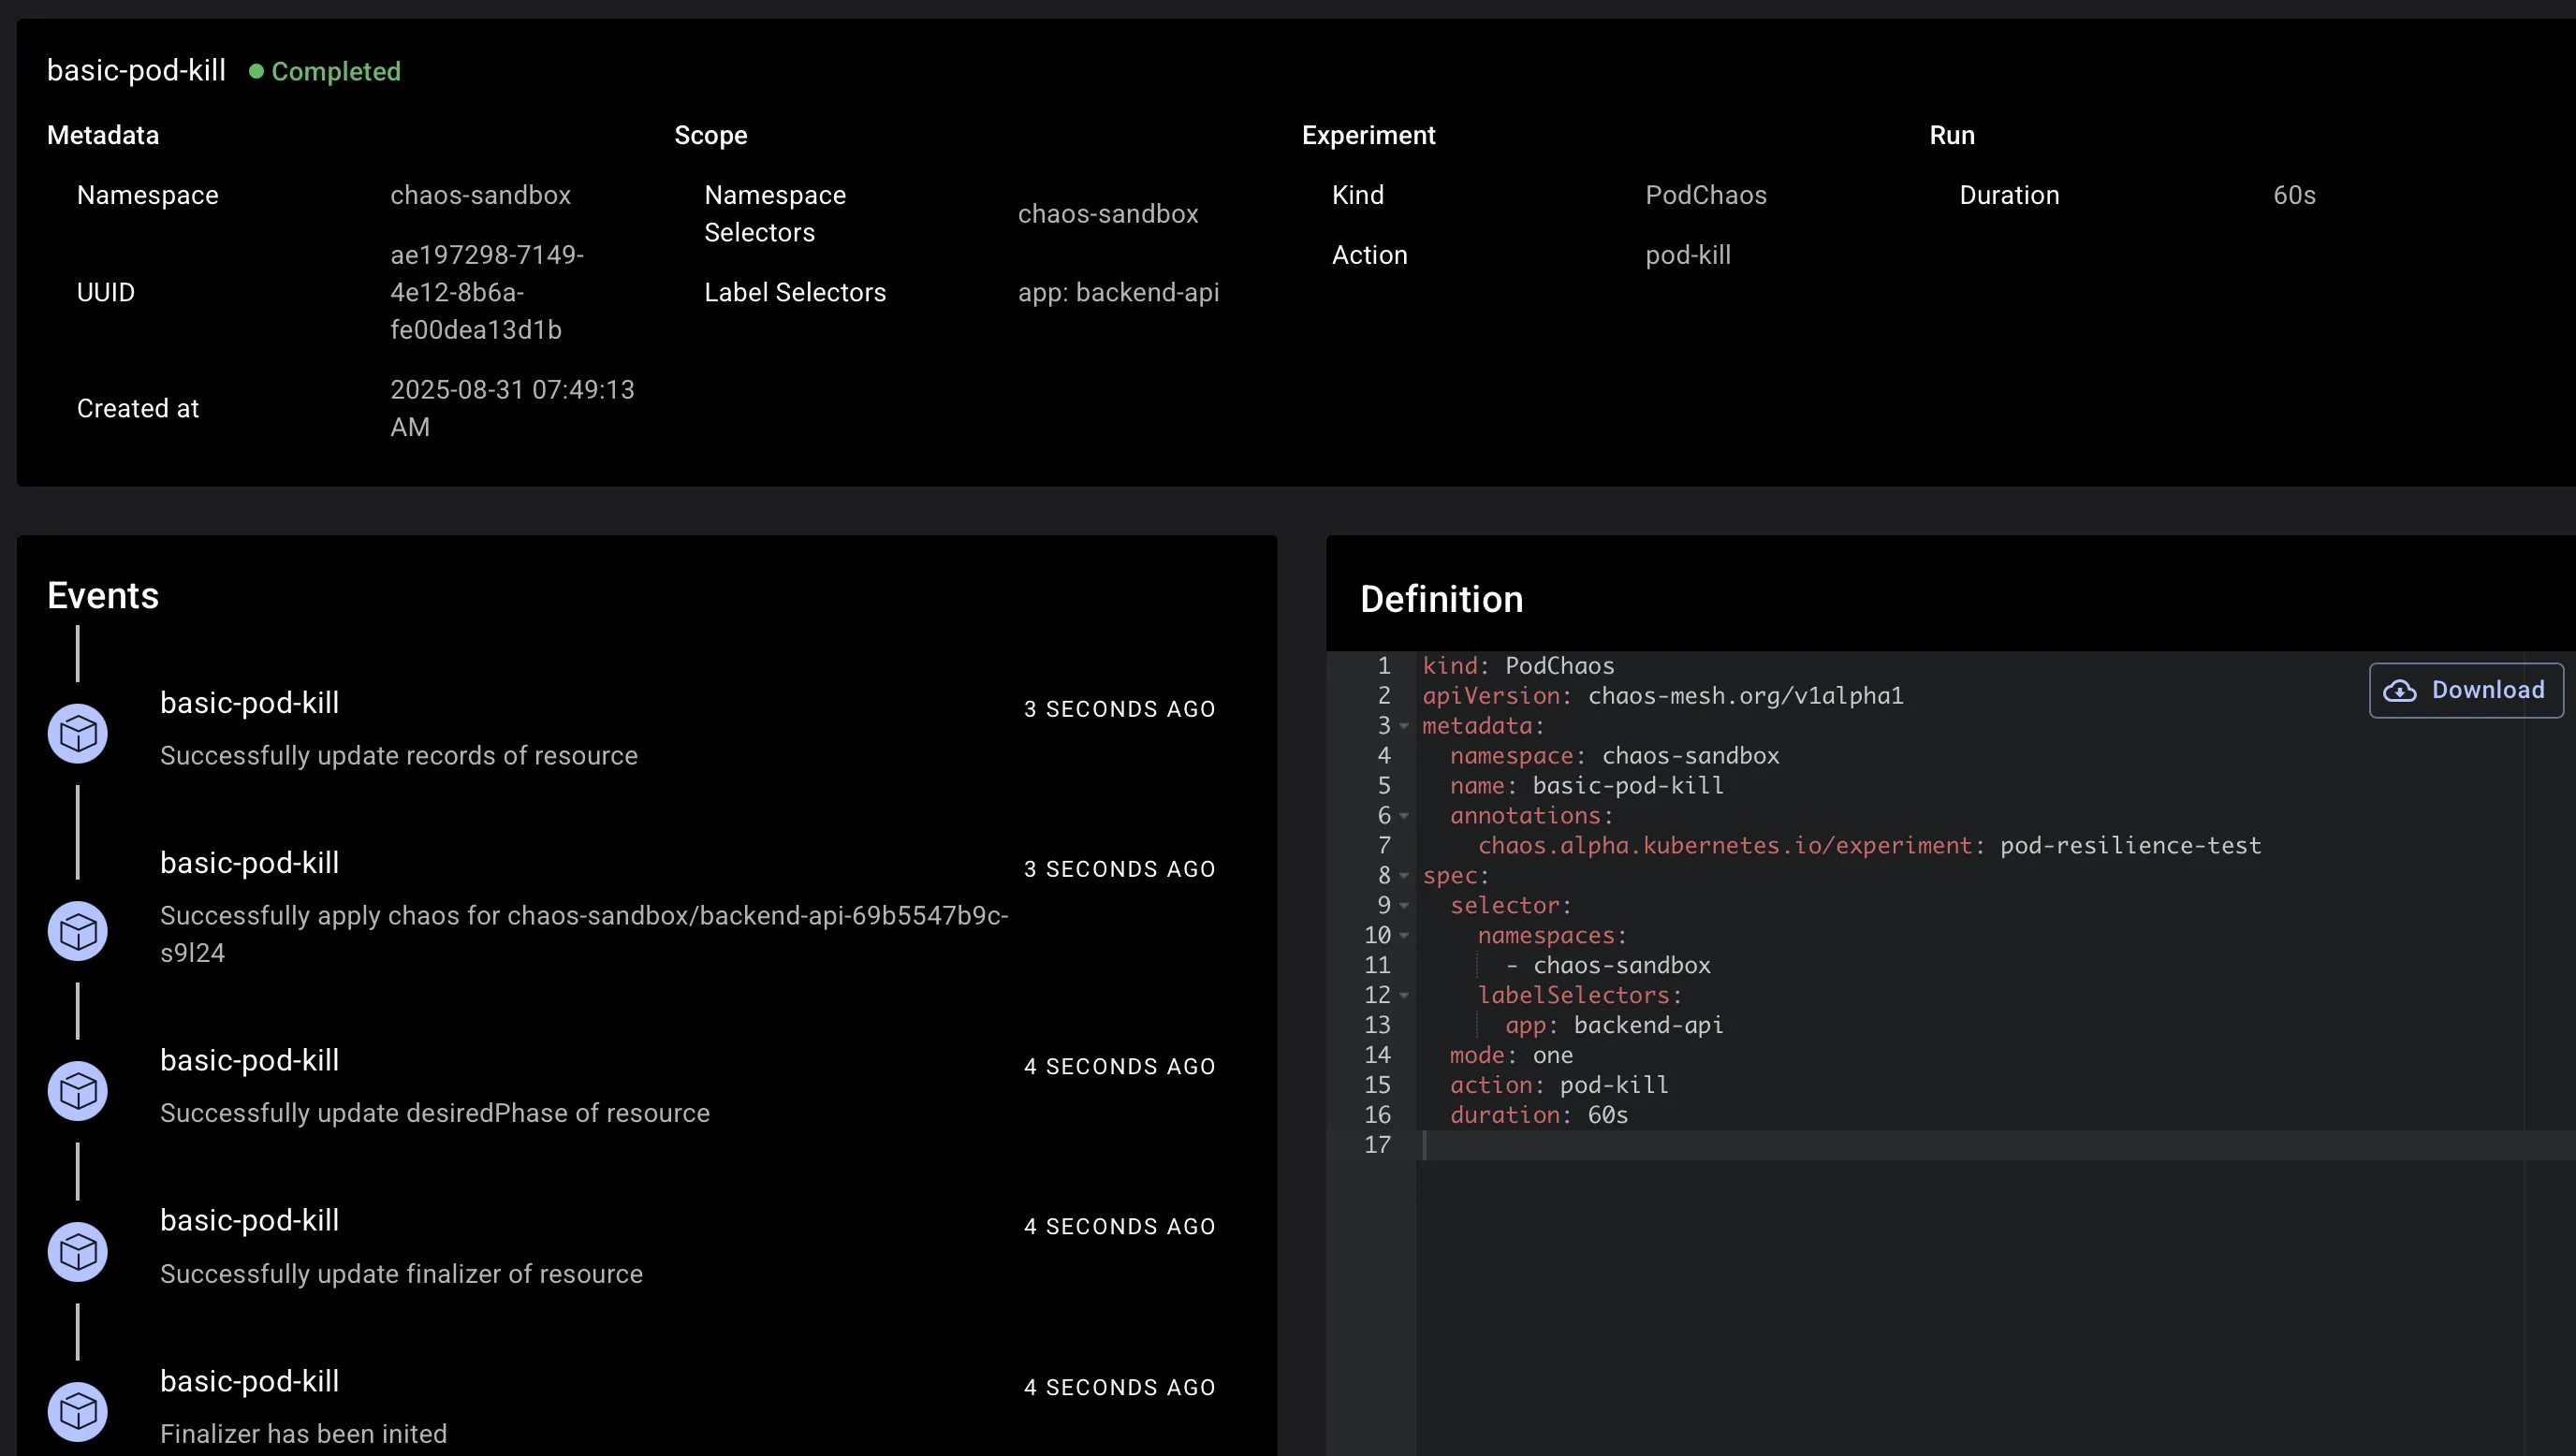
What You’ll Observe:
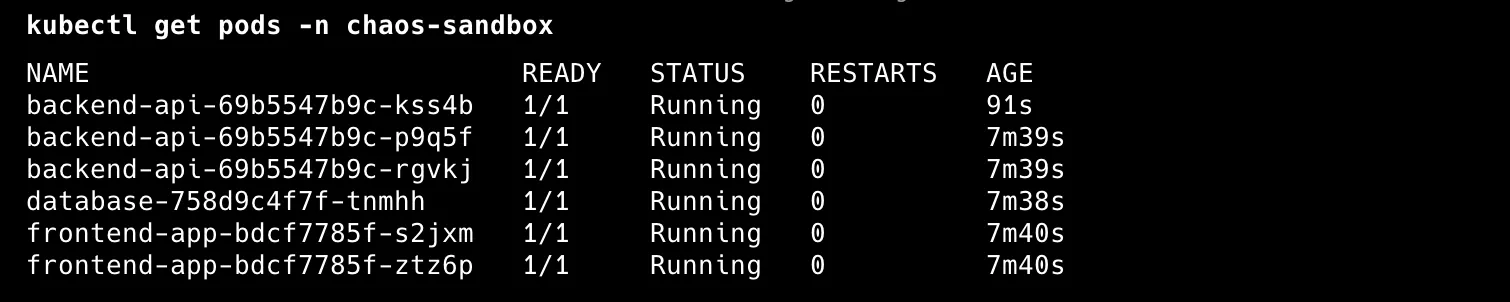
The targeted pod terminates immediately. Kubernetes creates a replacement within seconds. During this window, watch whether your frontend still serves requests or users get errors.
With three backend replicas, losing one shouldn’t disrupt service. Temporary response time increases as remaining pods handle full load are normal.
Most critical: watch the replacement pod’s startup time. Slow startup means longer user impact, often revealing the need for faster boot and proper health checks.
Why This Matters: This simulates rolling deployments, node maintenance, and container crashes. It tests whether application state is properly externalized and stateless design works.
2. High Latency API Simulation
External APIs get slow, causing cascading delays. Third-party services degrade, database queries slow down, network conditions change.
apiVersion: chaos-mesh.org/v1alpha1
kind: NetworkChaos
metadata:
  name: api-high-latency
  namespace: chaos-mesh
  annotations:
    chaos.alpha.kubernetes.io/experiment: "high-latency-api"
spec:
  action: delay
  mode: all                    # Affect all frontend pods
  duration: "120s"             # 2 minutes for observation
  selector:
    namespaces:
      - chaos-sandbox
    labelSelectors:
      app: frontend-app         # Target frontend pods
  delay:
    latency: "500ms"           # Half-second delay - users notice this
    correlation: "90"          # 90% of packets affected (realistic)
    jitter: "100ms"            # ±100ms variance for realism
  direction: to                # Only outgoing traffic (to backend)
  target:
    mode: all
    selector:
      namespaces:
        - chaos-sandbox
      labelSelectors:
        app: backend-api        # Only affect traffic to backend
Verify its execution and status:
kubectl -n chaos-mesh describe networkchaos api-high-latency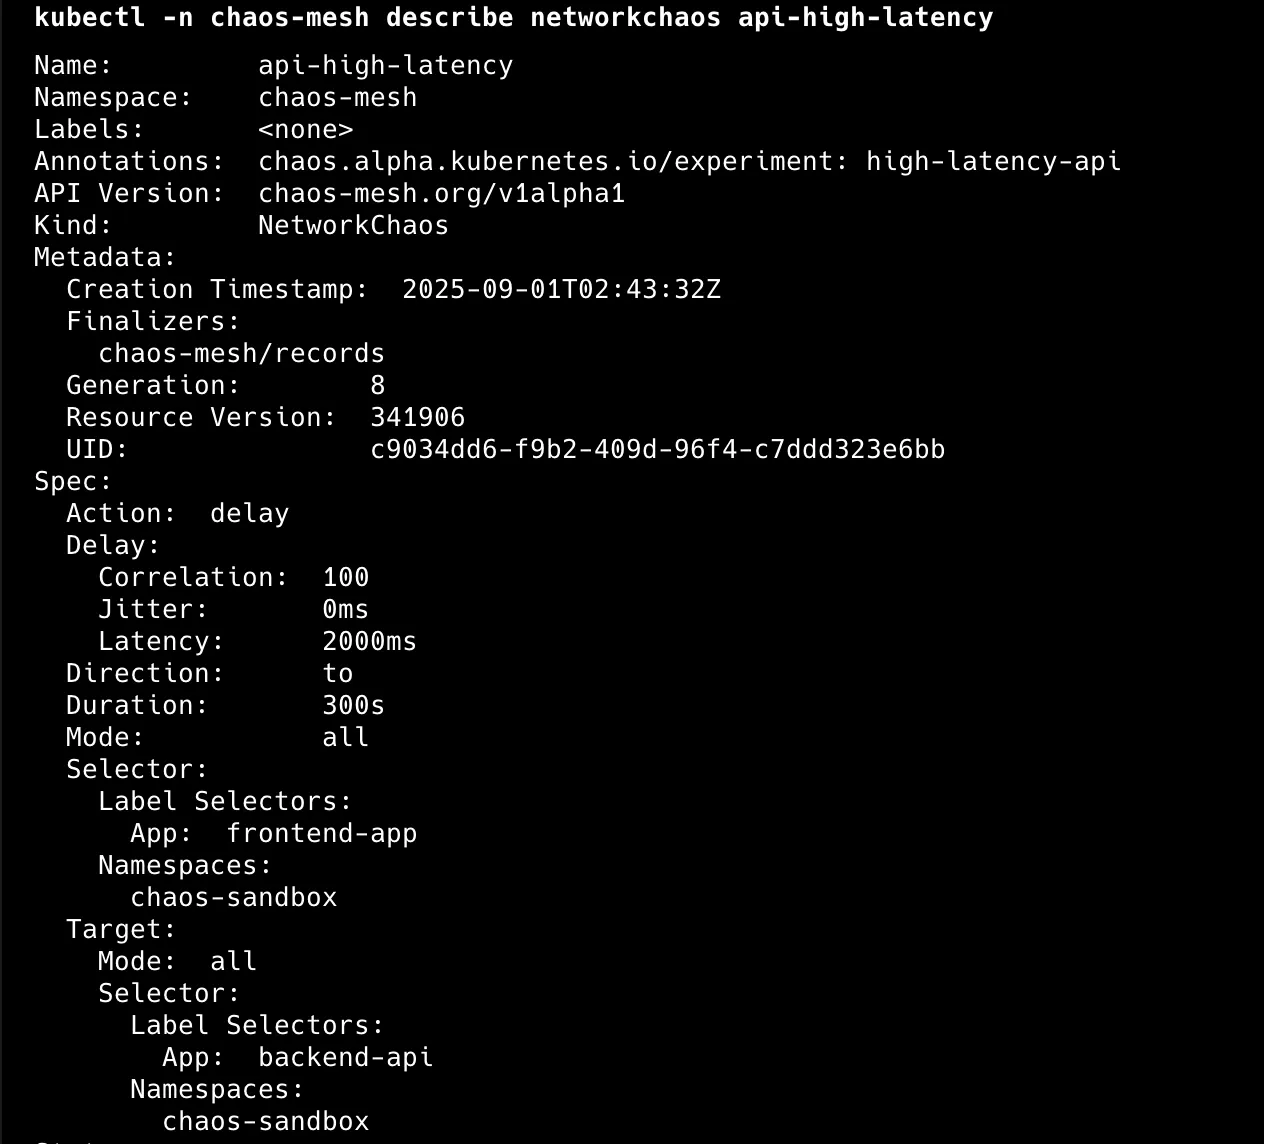
Also from dashboard:
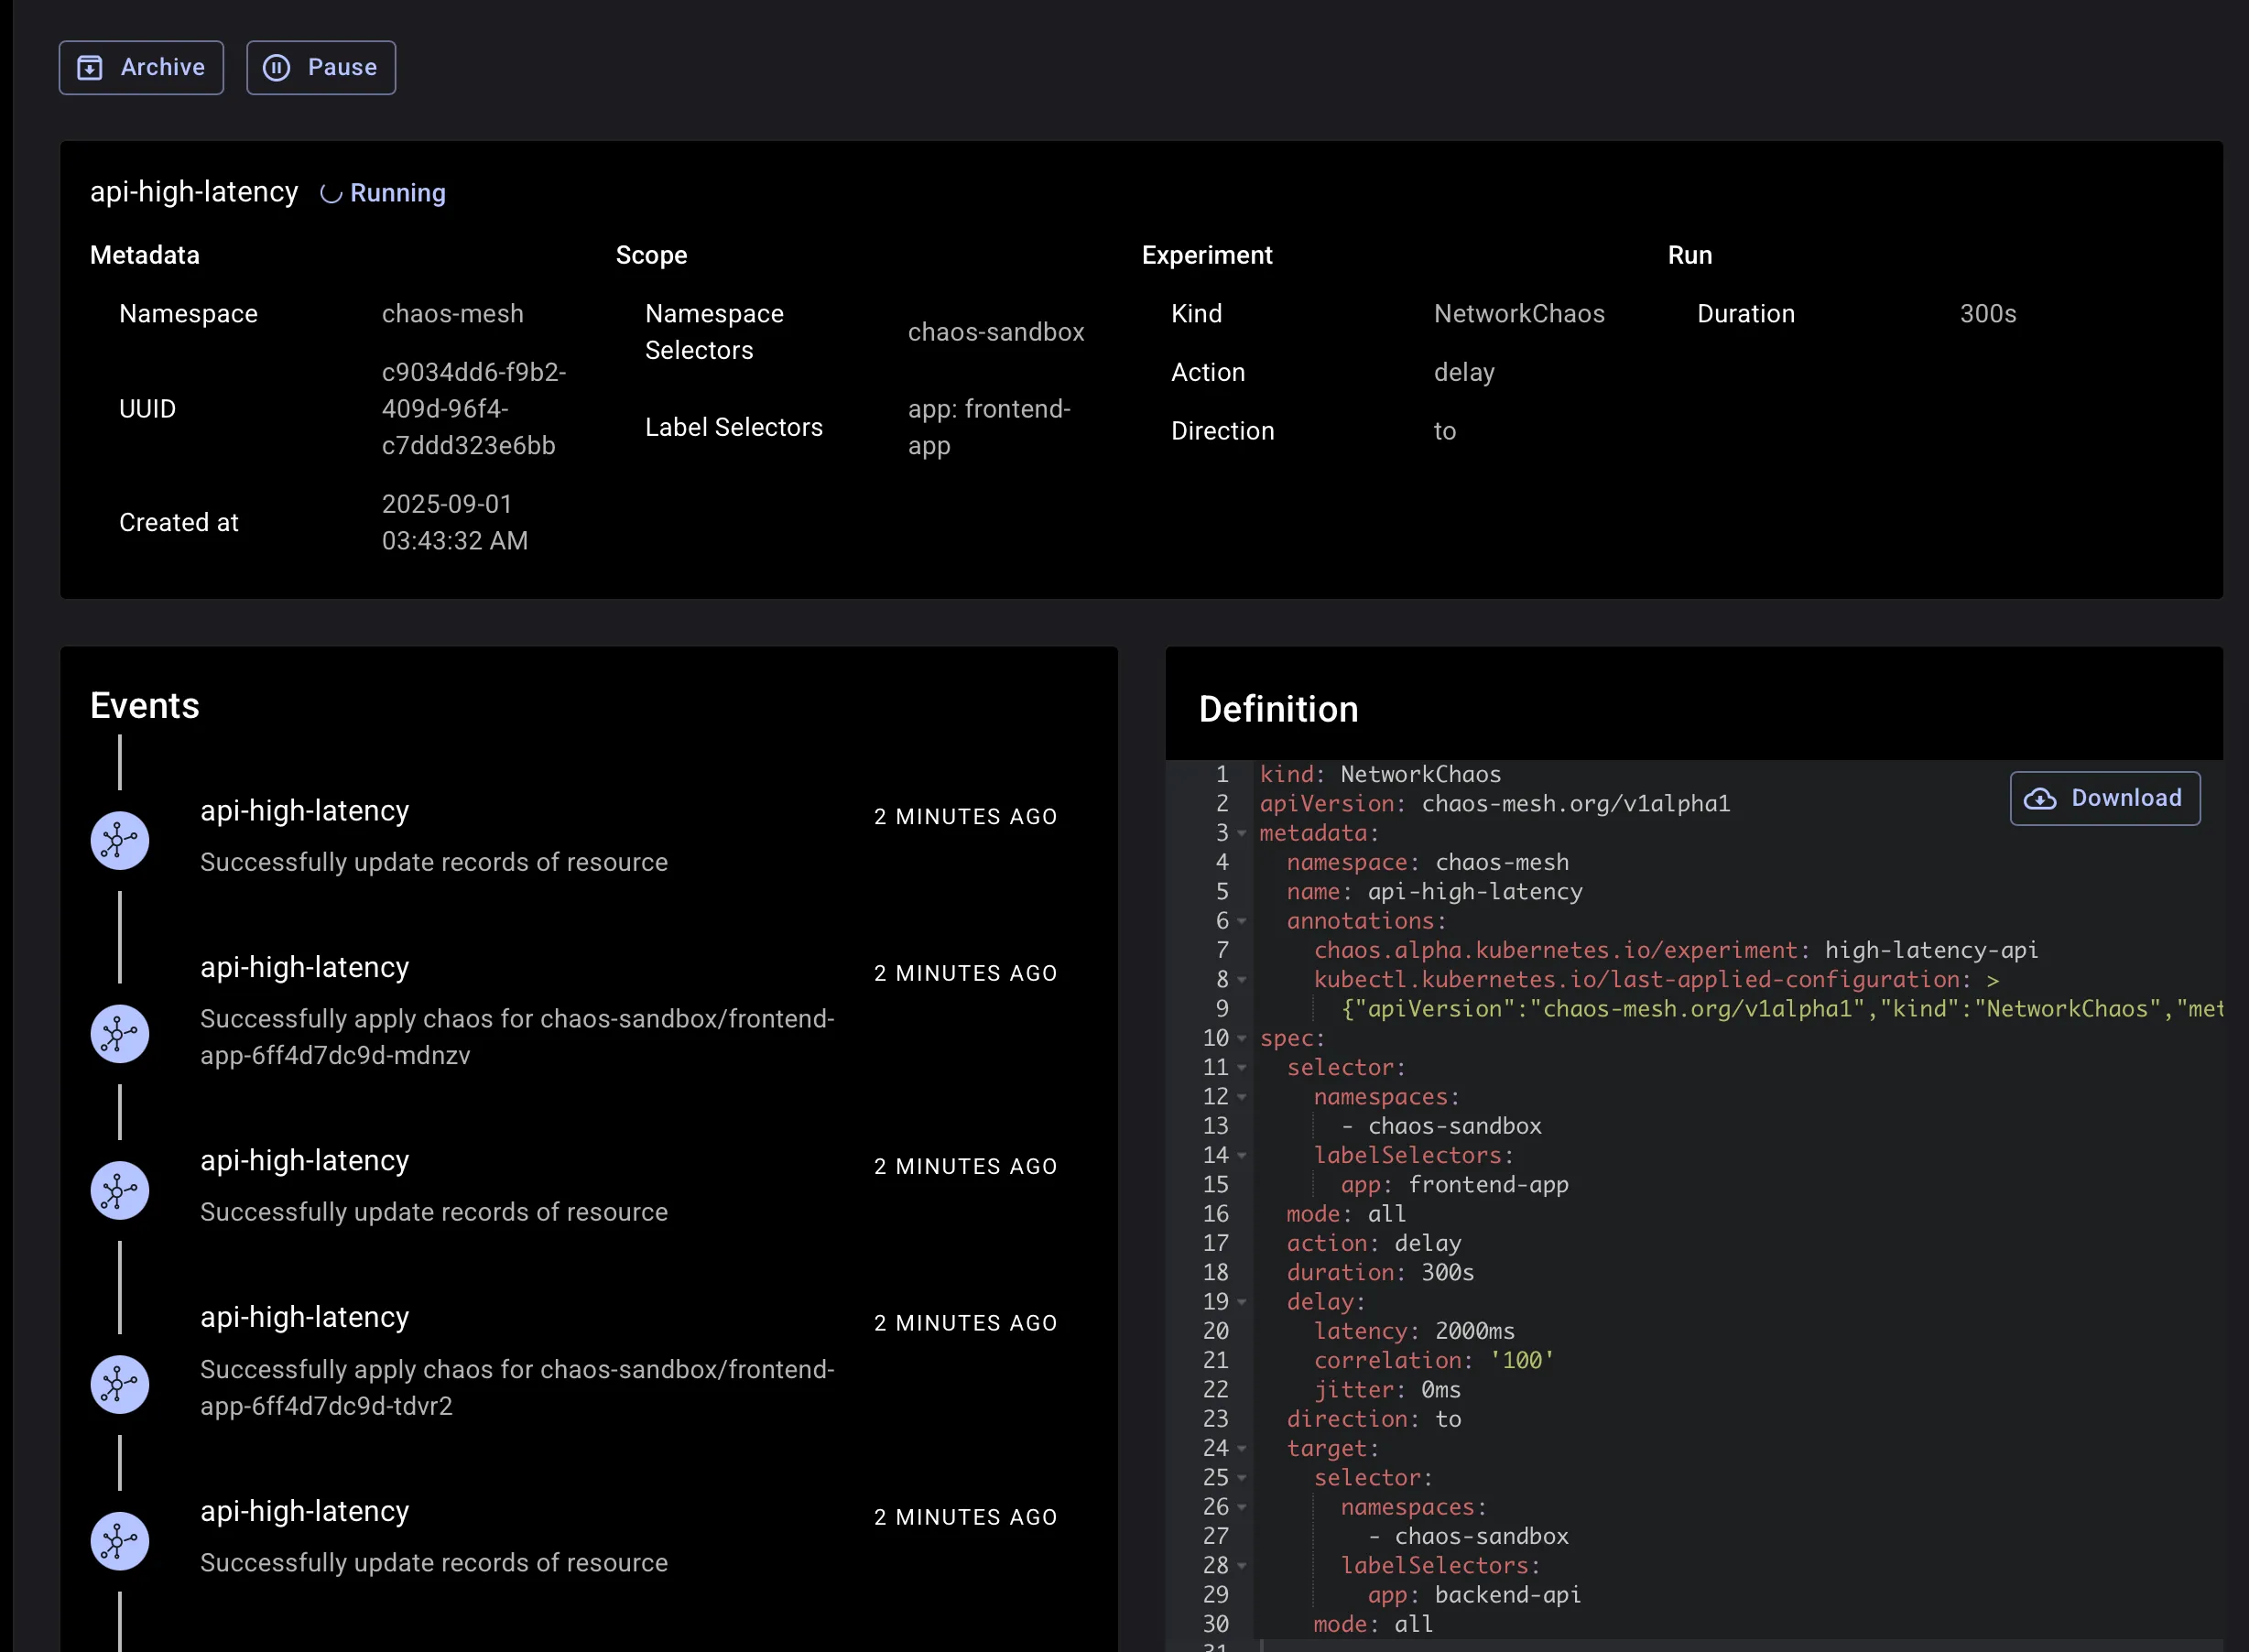
End-to-end latency increase on /api/: proves the delay “to backend” is applied.
kubectl -n chaos-sandbox port-forward svc/frontend-service 8080:80 & PID=$!before

after running

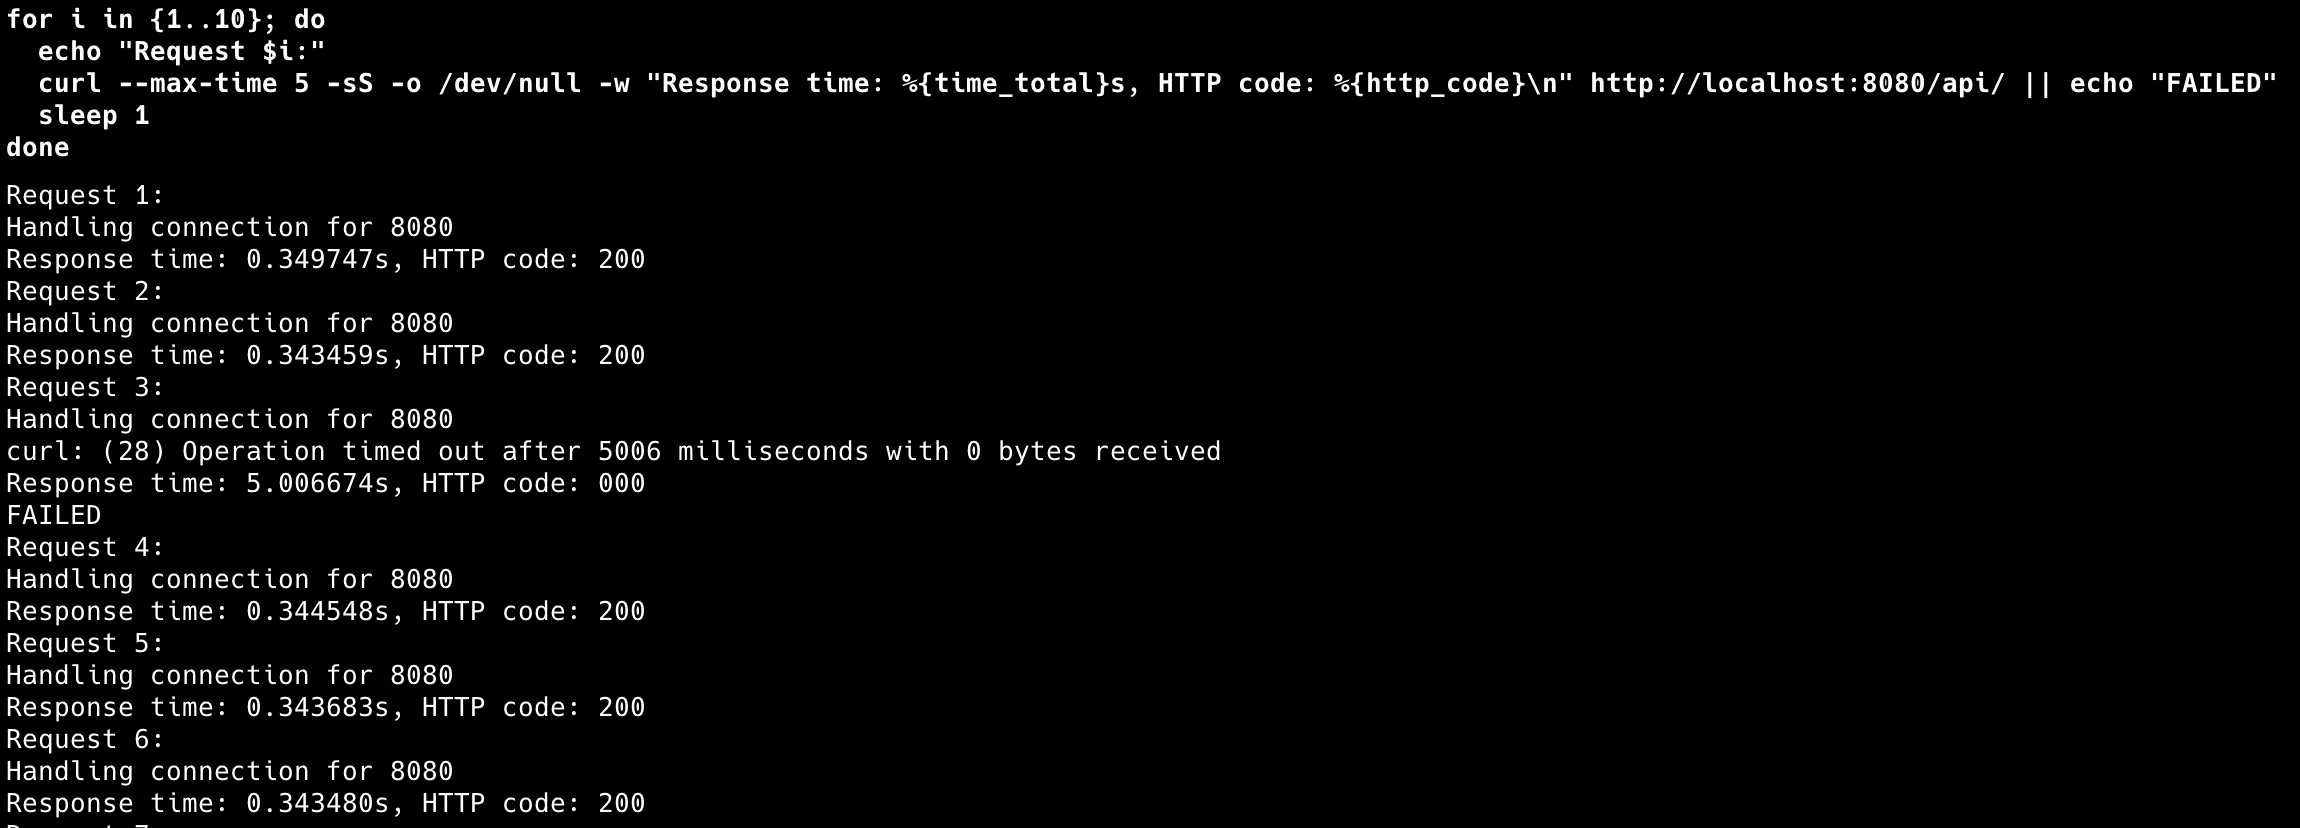
3. Packet Loss Scenarios
Cloud networks aren’t reliable. 15% packet loss sounds extreme, but I’ve seen worse.
apiVersion: chaos-mesh.org/v1alpha1
kind: NetworkChaos
metadata:
  name: packet-loss-scenario
  namespace: chaos-mesh
  annotations:
    chaos.alpha.kubernetes.io/experiment: "packet-loss"
spec:
  action: loss
  mode: one                    # Affect one backend pod at a time
  duration: "90s"              # 1.5 minutes observation window
  selector:
    namespaces:
      - chaos-sandbox
    labelSelectors:
      app: backend-api
  loss:
    loss: "15"                 # 15% packet loss
    correlation: "50"          # 50% correlation
  direction: both              # Affect both request and response traffic
for i in {1..10}; do
echo "Request $i:"
curl --max-time 5 -sS -o /dev/null -w "Response time: %{time_total}s, HTTP code: %{http_code}\n" http://localhost:8080/api/ || echo "FAILED"
sleep 1
donebefore
after
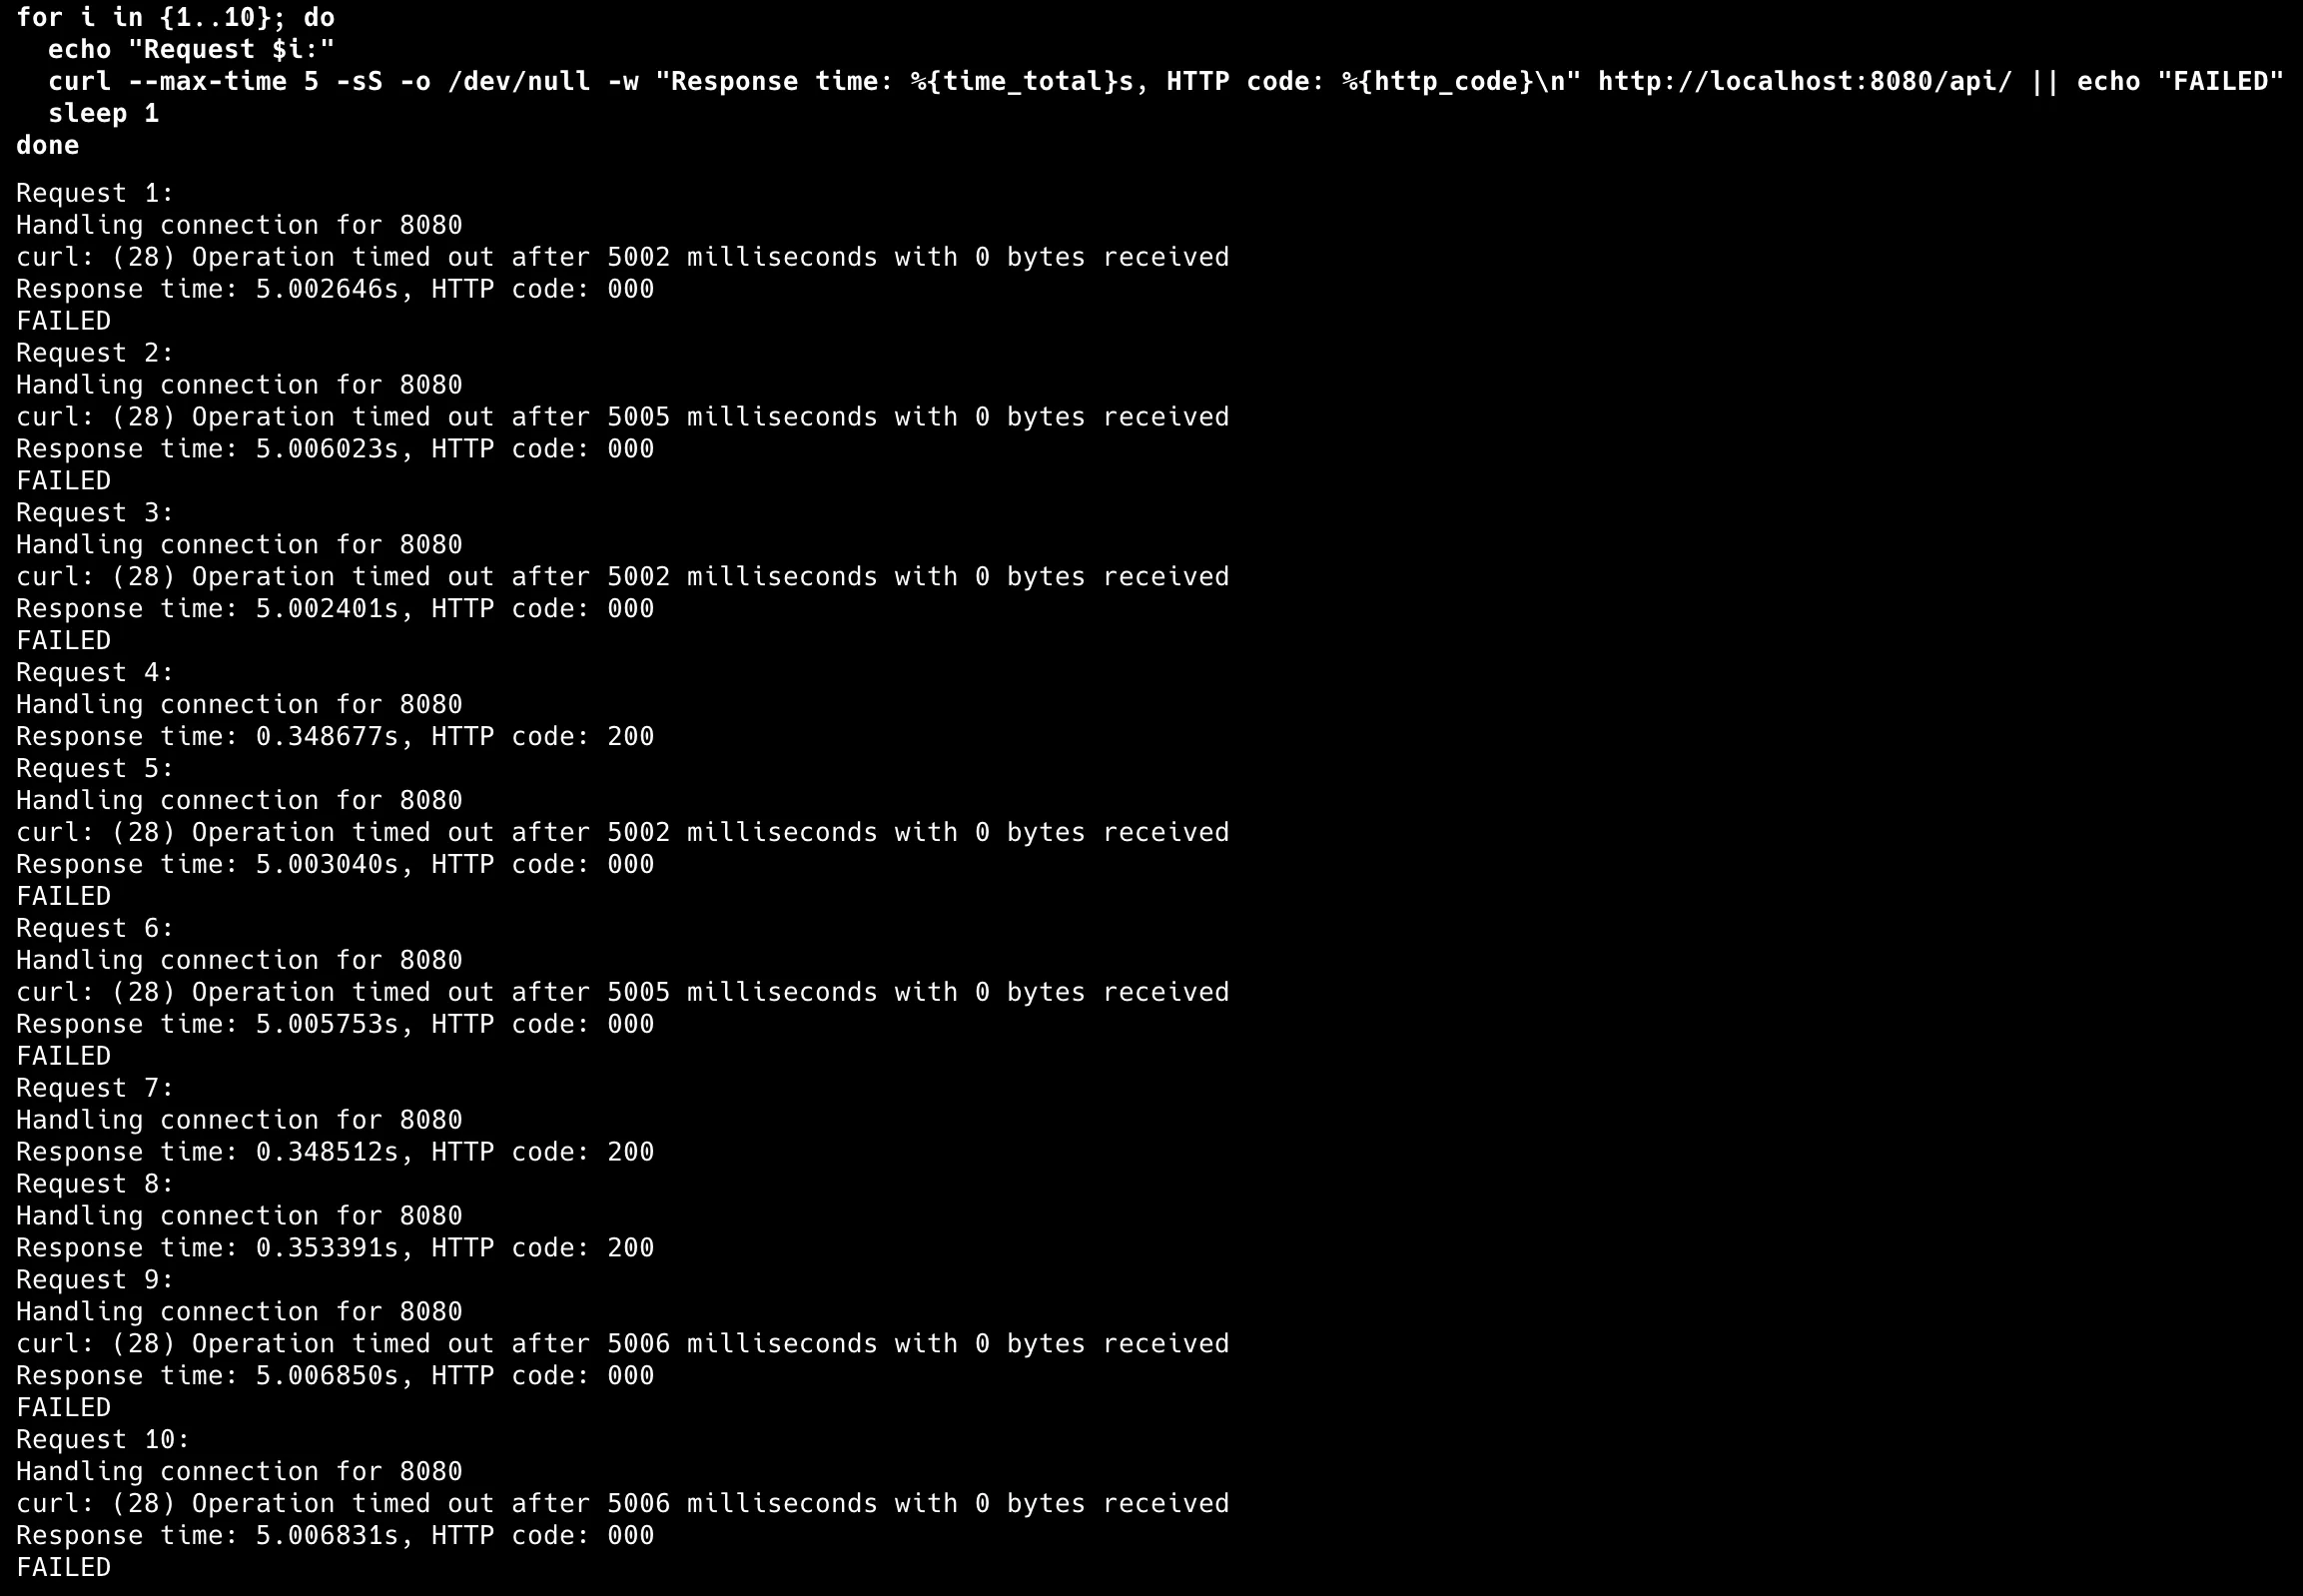
Results show the reality of network failures: • Successful requests: Response time: 0.348s, HTTP code: 200
• Failed requests: Operation timed out after 5002ms, HTTP code: 000
4. Network Partitioning (Split Brain)
Complete network isolation: the nightmare scenario where services can’t talk to each other.
apiVersion: chaos-mesh.org/v1alpha1
kind: NetworkChaos
metadata:
  name: database-partition
  namespace: chaos-mesh
  annotations:
    chaos.alpha.kubernetes.io/experiment: "database-isolation"
spec:
  action: partition
  mode: all                    # Isolate all database instances
  duration: "120s"              # Short duration - this breaks the app
  selector:
    namespaces:
      - chaos-sandbox
    labelSelectors:
      app: database             # Target database pods
  direction: both              # isolate database
  target:
    mode: all
    selector:
      namespaces:
        - chaos-sandbox
      labelSelectors:
        app: backend-api        # From backend API pods
Results are brutal, but expected:
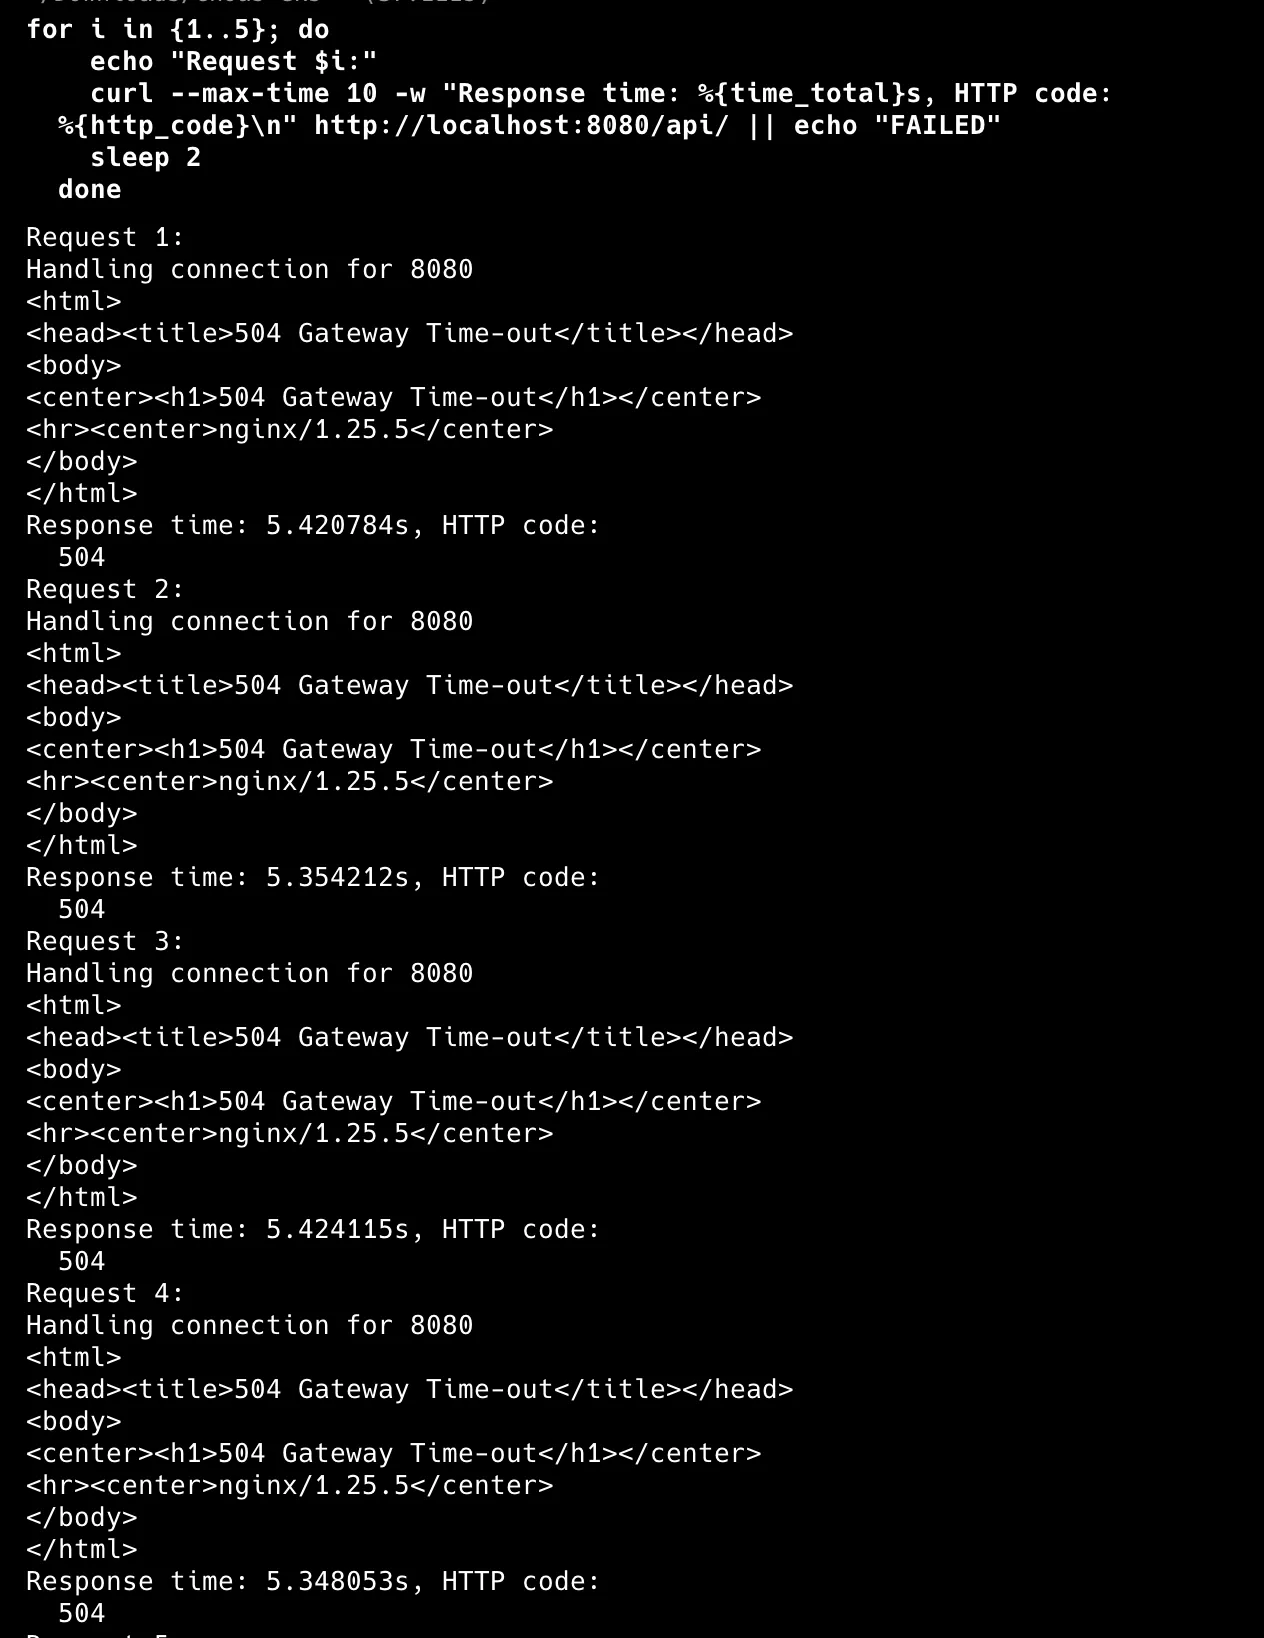
• 100% failure rate: All requests fail or timeout
• Long response times (up to 10s) as backend can’t reach database
• Complete application breakdown: total database outage simulation
5. Progressive Degradation
Systems rarely fail instantly. They slow down as load increases, dependencies degrade, or resource pressure builds.
apiVersion: chaos-mesh.org/v1alpha1
kind: NetworkChaos
metadata:
  name: progressive-delay
  namespace: chaos-mesh
  annotations:
    chaos.alpha.kubernetes.io/experiment: "progressive-degradation"
spec:
  action: delay
  mode: all                    # Affect all backend pods
  duration: "300s"             # 5 minutes total observation
  selector:
    namespaces:
      - chaos-sandbox
    labelSelectors:
      app: backend-api
  delay:
    latency: "50ms"            # Start with small delay
    correlation: "100"         # Affect all traffic for consistency
    jitter: "10ms"             # Small jitter in intervals
  direction: both              # Affect both directions

  # For progressive testing, you'd run multiple experiments
  # with increasing latency values: 100ms -> 500ms -> 1000ms -> 3000ms
Run multiple experiments with increasing latency: 100ms, 500ms, 1000ms, 3000ms. Each phase reveals a threshold where user experience breaks.
Best Practices from Implementations
Start Ridiculously Small Begin with 30-60 second experiments affecting one pod. I once jumped into a 10-minute network partition without preparation, and the team panicked, thinking we had a real outage. Starting small teaches blast radius and builds trust.
Baseline Everything Run monitoring scripts across different periods before any chaos. That 200ms response time during chaos, is it the experiment or normal variance? Baseline performance is crucial for accurate assessment.
Auto-Termination is Non-Negotiable Set explicit durations and verify they work. One experiment ran overnight because duration limits failed, so now I test termination in staging first. Uncontrolled chaos is just breaking things, not chaos engineering.
Document Immediately Keep a simple log: what you tested, what happened, what you learned. Three weeks after our database chaos testing, production had a similar connectivity issue, and our notes fixed it in minutes instead of hours. These become your incident playbook.
Production Chaos Needs Safeguards Rollback procedures ready. Stakeholders informed. “Stop everything” mechanism tested. Production chaos isn’t reckless, it’s controlled testing with multiple safety nets, and every experiment needs explicit approval and monitoring.
Chaos Engineering Going Further
AWS FIS Integration The natural evolution is AWS Fault Injection Simulator, a native chaos service with built-in safeguards. Orchestrate experiments through FIS instead of Chaos Mesh: stop EC2 instances, throttle EBS volumes, simulate AZ failures. It integrates with Systems Manager and CloudWatch for scheduling and auto-rollback.
GitOps Chaos Pipeline Treat chaos experiments as infrastructure code. Commit configs to Git, auto-validate in staging, schedule production runs during maintenance windows. Teams propose scenarios through PRs, with automated execution and per-environment safety controls.
Advanced Observability Replace simple scripts with Prometheus, Grafana, and CloudWatch integration: real-time dashboards, historical resilience trends, automatic correlation between chaos events and system behavior. Auto-terminate on custom metrics and integrate with PagerDuty for incident response testing.
Multi-Region Chaos Test disaster recovery with cross-region failures: entire AZ failures, regional degradations, cross-region network partitions. Validate that multi-region architectures deliver the resilience promised.
Resource Exhaustion Testing CPU exhaustion, memory pressure, disk I/O bottlenecks, both container-level (Chaos Mesh) and infrastructure-level (FIS). Optimize resource allocation, validate auto-scaling, prevent cascading failures.
Conclusion
Chaos engineering taught me more about my systems in a week than six months of “everything’s working fine” monitoring. You discover hidden dependencies, weak retry logic, and timeout configs that seemed fine until they weren’t.
The goal isn’t breaking things for fun. It’s building confidence that when production fails, your team knows what to check first. You’ve seen the patterns before, know which metrics matter, and have muscle memory for recovery.
Start small. Baseline everything. Document findings. But most importantly, start. Your systems are already fragile. Chaos engineering just helps you find out how fragile before your users do.