Runtime Security on EKS: Tetragon eBPF Enforcement, Falco Detection, and GuardDuty
Tetragon eBPF, Falco, and GuardDuty Runtime Monitoring stacked on EKS. Tetragon kills violating processes in-kernel, Falco keeps a queryable alert history, and GuardDuty catches attacks that dodge path-based blocking by running renamed binaries.
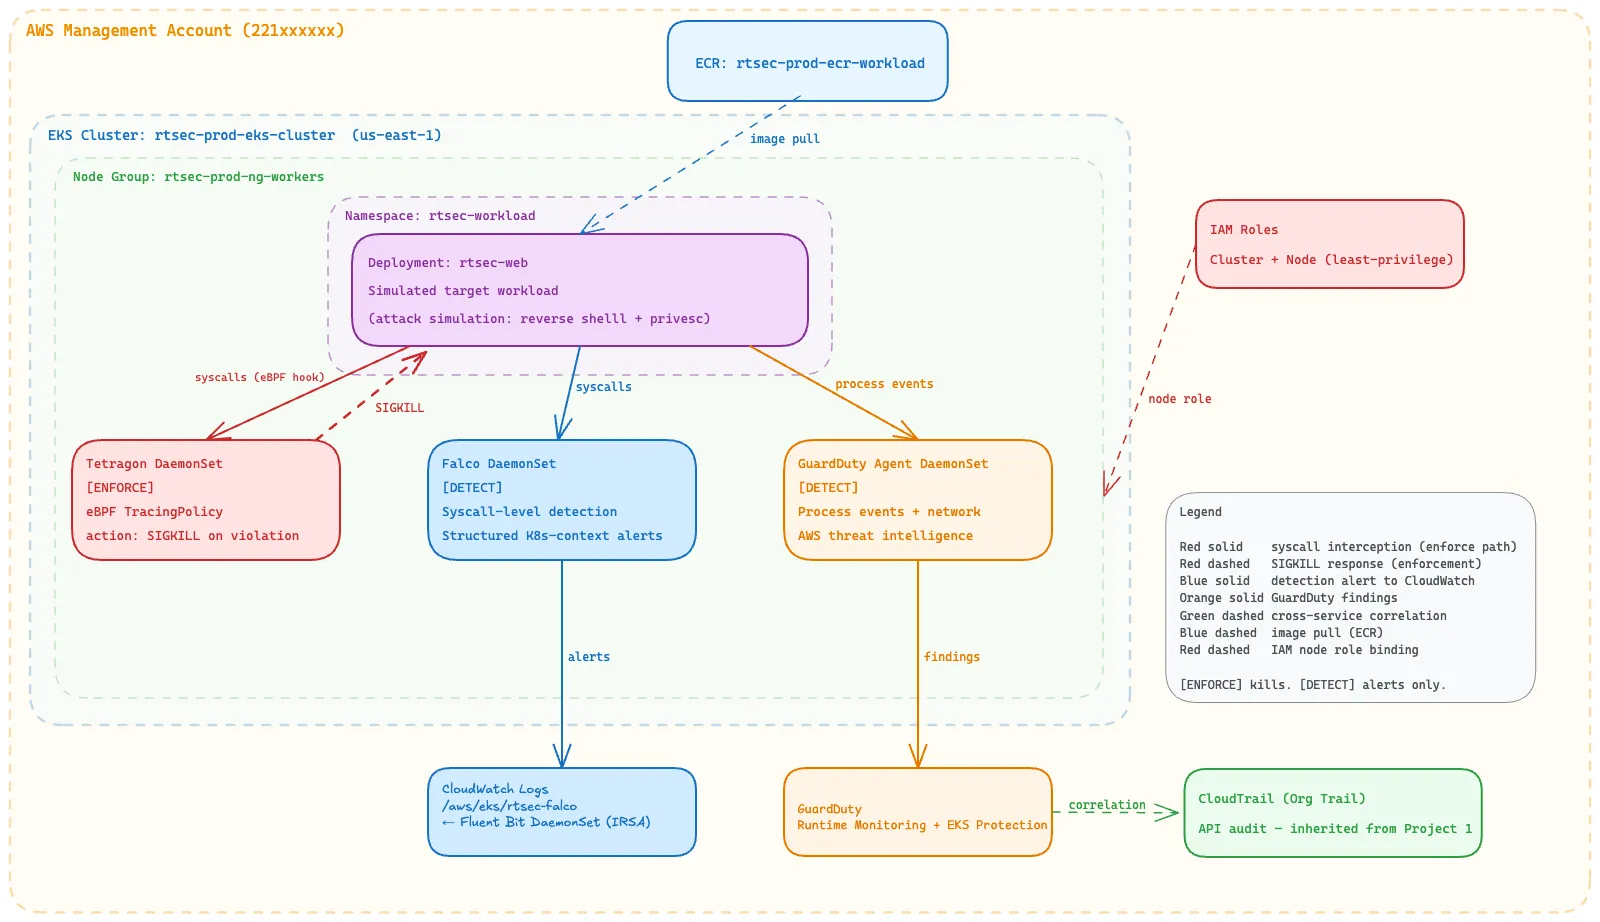
Image scanning catches known vulnerabilities before shipping. It says nothing about what happens after the container starts running. A clean scan means no known CVEs at build time. It does not mean the running process won’t read /etc/shadow, spawn a shell, or execute a binary named after a known crypto miner. Those are runtime behaviours: they happen at the syscall layer, in kernel space, where no scanner looks.
This project builds a three-layer runtime security stack on EKS: Tetragon for kernel-level enforcement, Falco for structured detection and alert history, and GuardDuty Runtime Monitoring for AWS-managed threat intelligence. The cluster runs on AL2023 with kernel 6.1, two t3.medium nodes, and a single nginx workload as the enforcement target.
The interesting part is understanding what each layer guarantees. “Runtime security” describes tools with very different contracts.
Enforcement vs Detection
Falco hooks the kernel via eBPF, observes syscalls, and emits an alert when a rule fires. By the time the alert fires, the syscall has completed. If a process called execve("/bin/sh", ...), Falco saw it, fired a Terminal shell in container rule, and the shell is already running. Detection is not prevention.
Tetragon also hooks the kernel via eBPF, but it executes the policy decision inside the BPF program, before the syscall returns to userspace. When a TracingPolicy fires with action: Sigkill, the kernel delivers SIGKILL to the offending process in that same hook. In this configuration, the process never got control back and the syscall never completed. That’s a categorically different model from detection after the fact. The guarantee is only as strong as the policy coverage and the kernel or tool version underneath it.
GuardDuty Runtime Monitoring is also detection-only, but the signal quality differs from Falco. The GuardDuty agent observes kernel-level process events and correlates them against AWS threat intelligence, VPC flow logs, and CloudTrail history. It surfaces behavioural patterns like Impact:Runtime/CryptoMinerExecuted at severity 8.0. In this lab, findings appeared within 5 to 15 minutes. The agent batches kernel events before analysis, so timing isn’t deterministic. It sees account-wide context; Falco sees one node’s syscalls.
The three layers aren’t redundant. Tetragon prevents what it’s configured to prevent. Falco detects and records what Tetragon has no policy for. GuardDuty surfaces things that only make sense as part of a larger pattern.
The Cluster
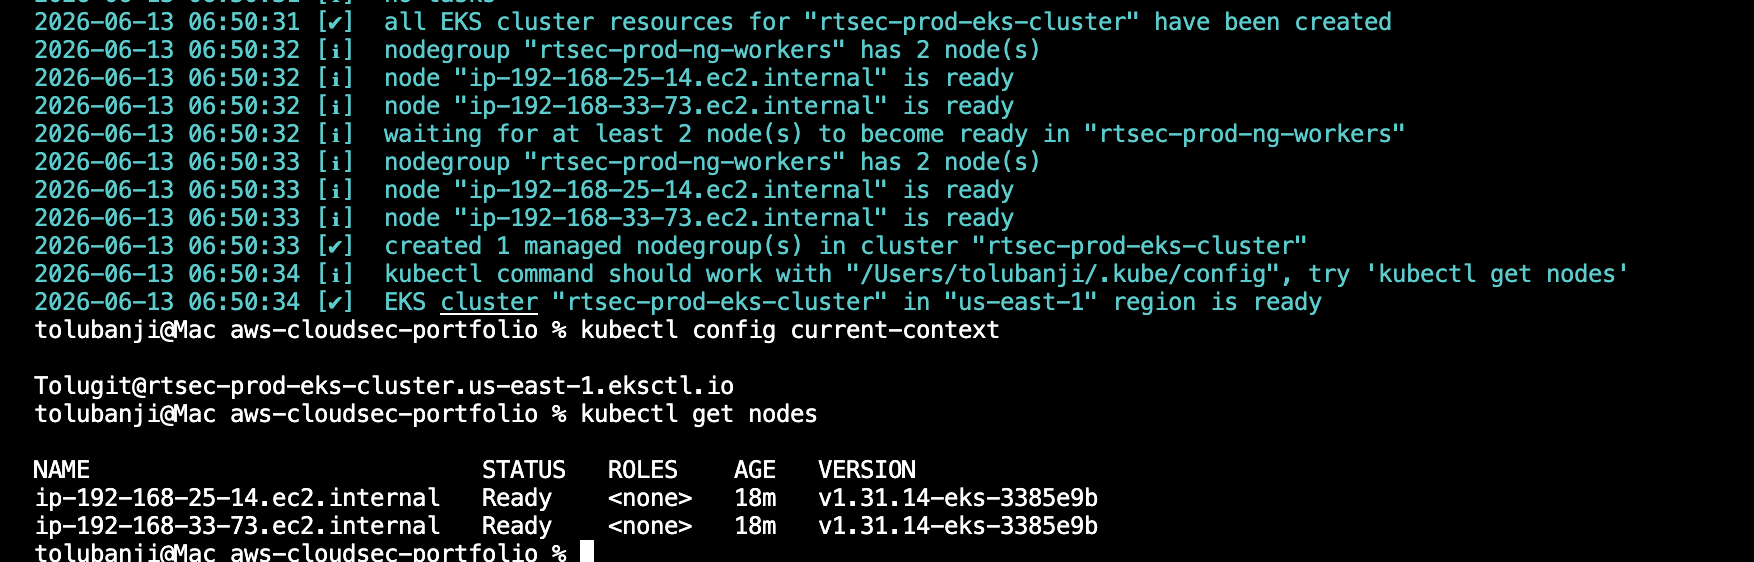
Two t3.medium nodes on AL2023 (kernel 6.1.172). Node size matters: Tetragon and Falco both run as DaemonSets with kernel-level hooks, needing 200 to 400 MB each before any workload pod runs. A first attempt on t3.small hit repeated OOMKilled errors on the Falco pod before the rules engine finished loading. t3.medium was the floor that worked; yours may differ with other tool versions or a lighter workload. Size up before chasing what looks like a Falco startup failure.
AL2023 is the required AMI family for Falco’s modern_ebpf driver. The classic Falco driver builds kernel modules against DKMS headers, which AL2023 does not ship. The modern_ebpf driver uses CO-RE BTF from the running kernel’s own metadata at /sys/kernel/btf/vmlinux, so it needs no kernel headers. On AL2023 it’s the only option, not a fallback.
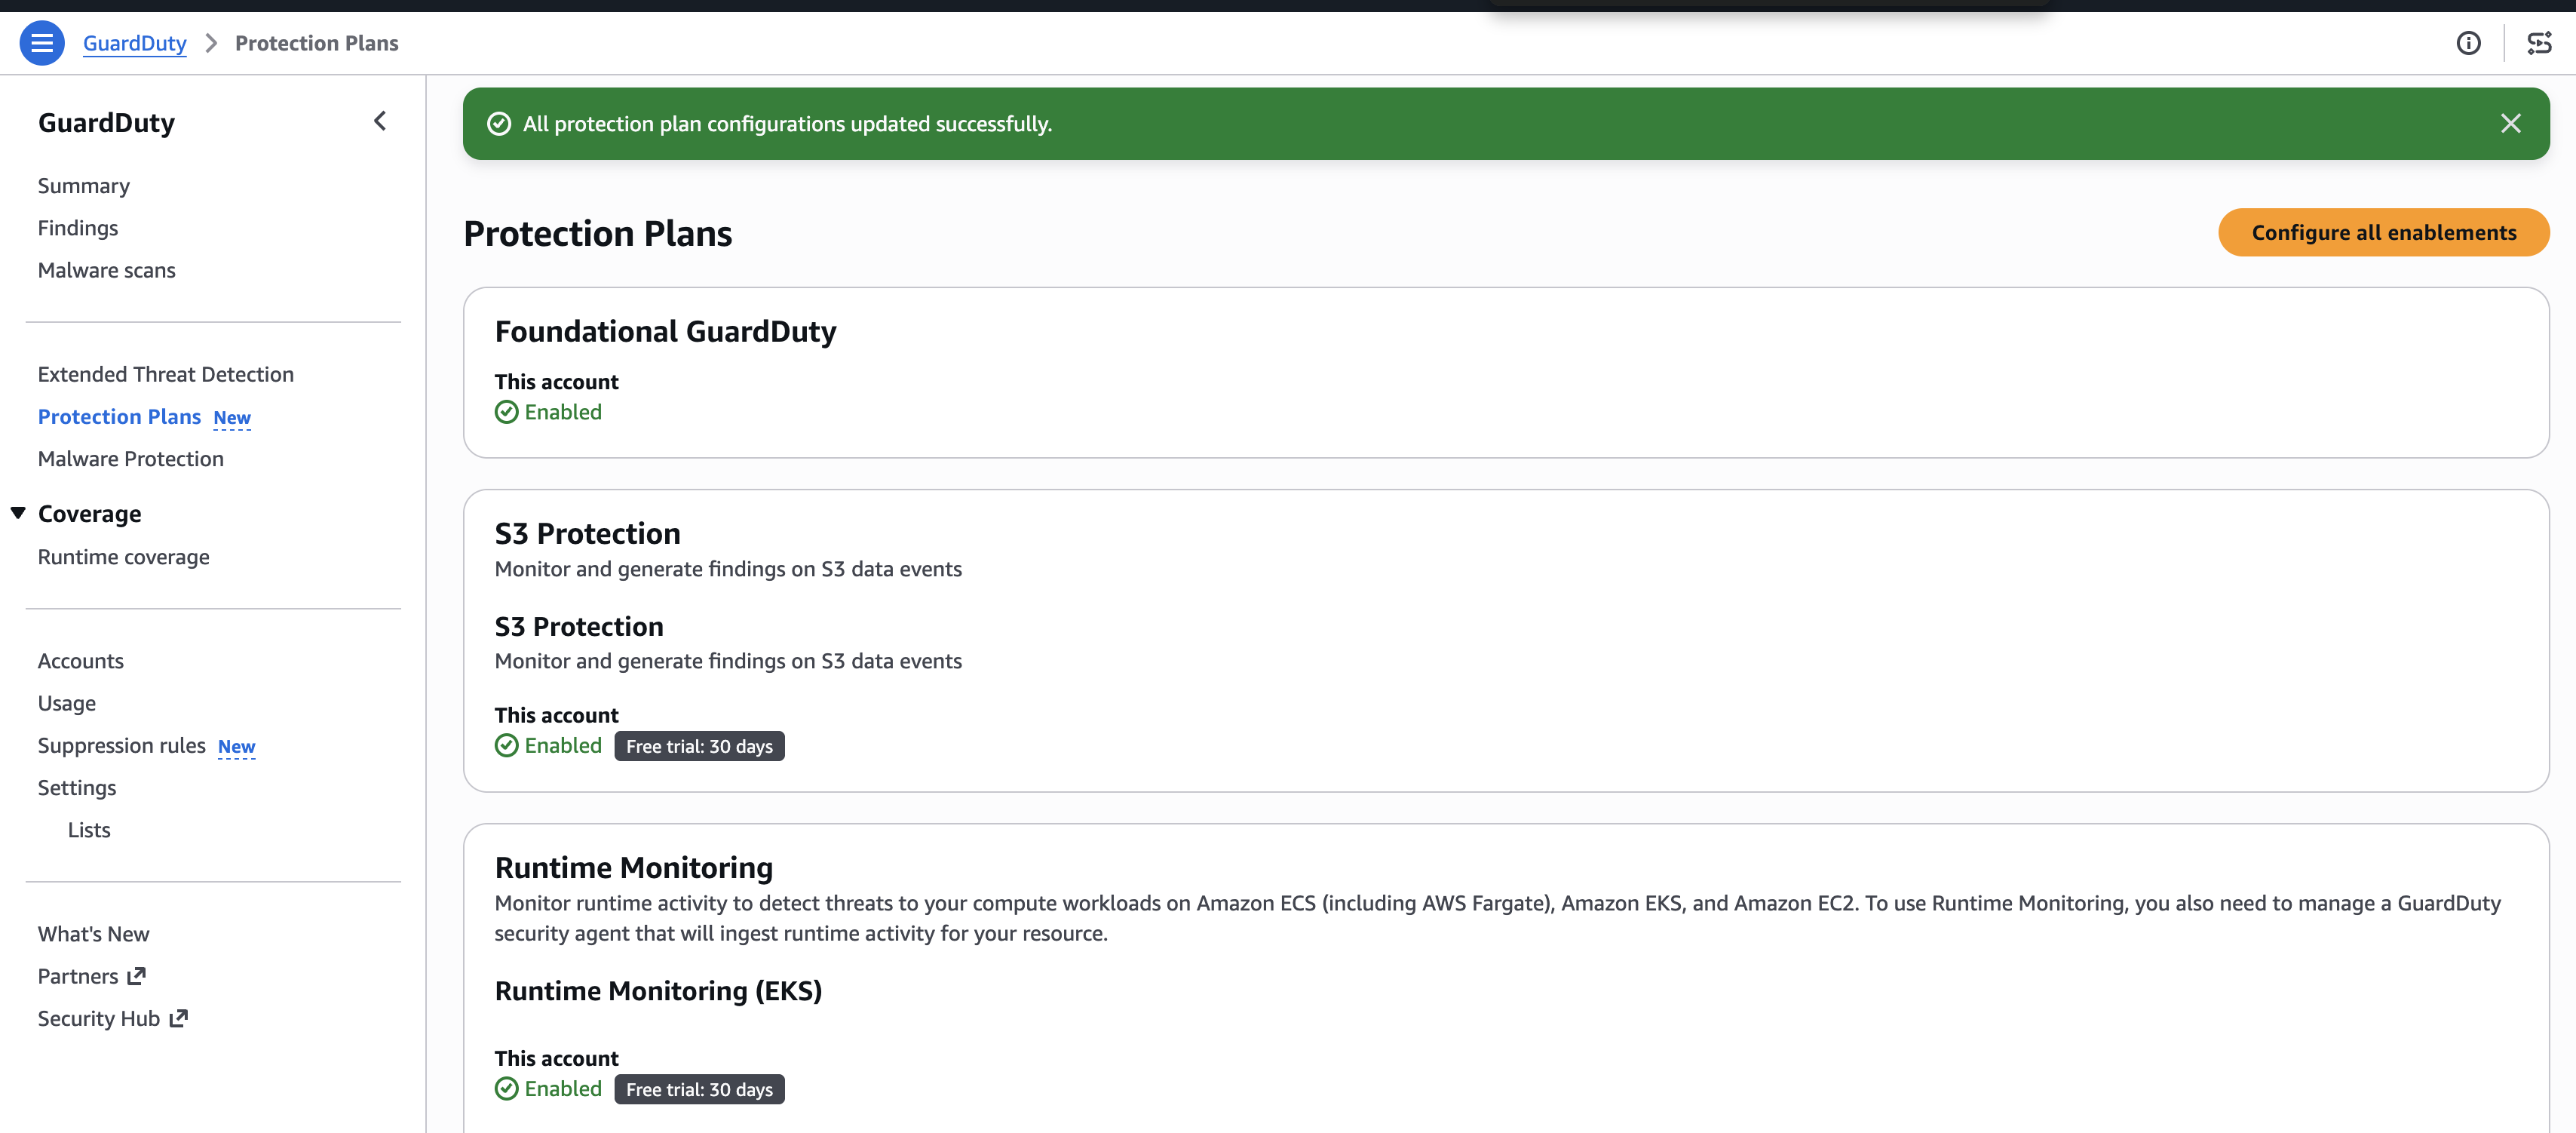
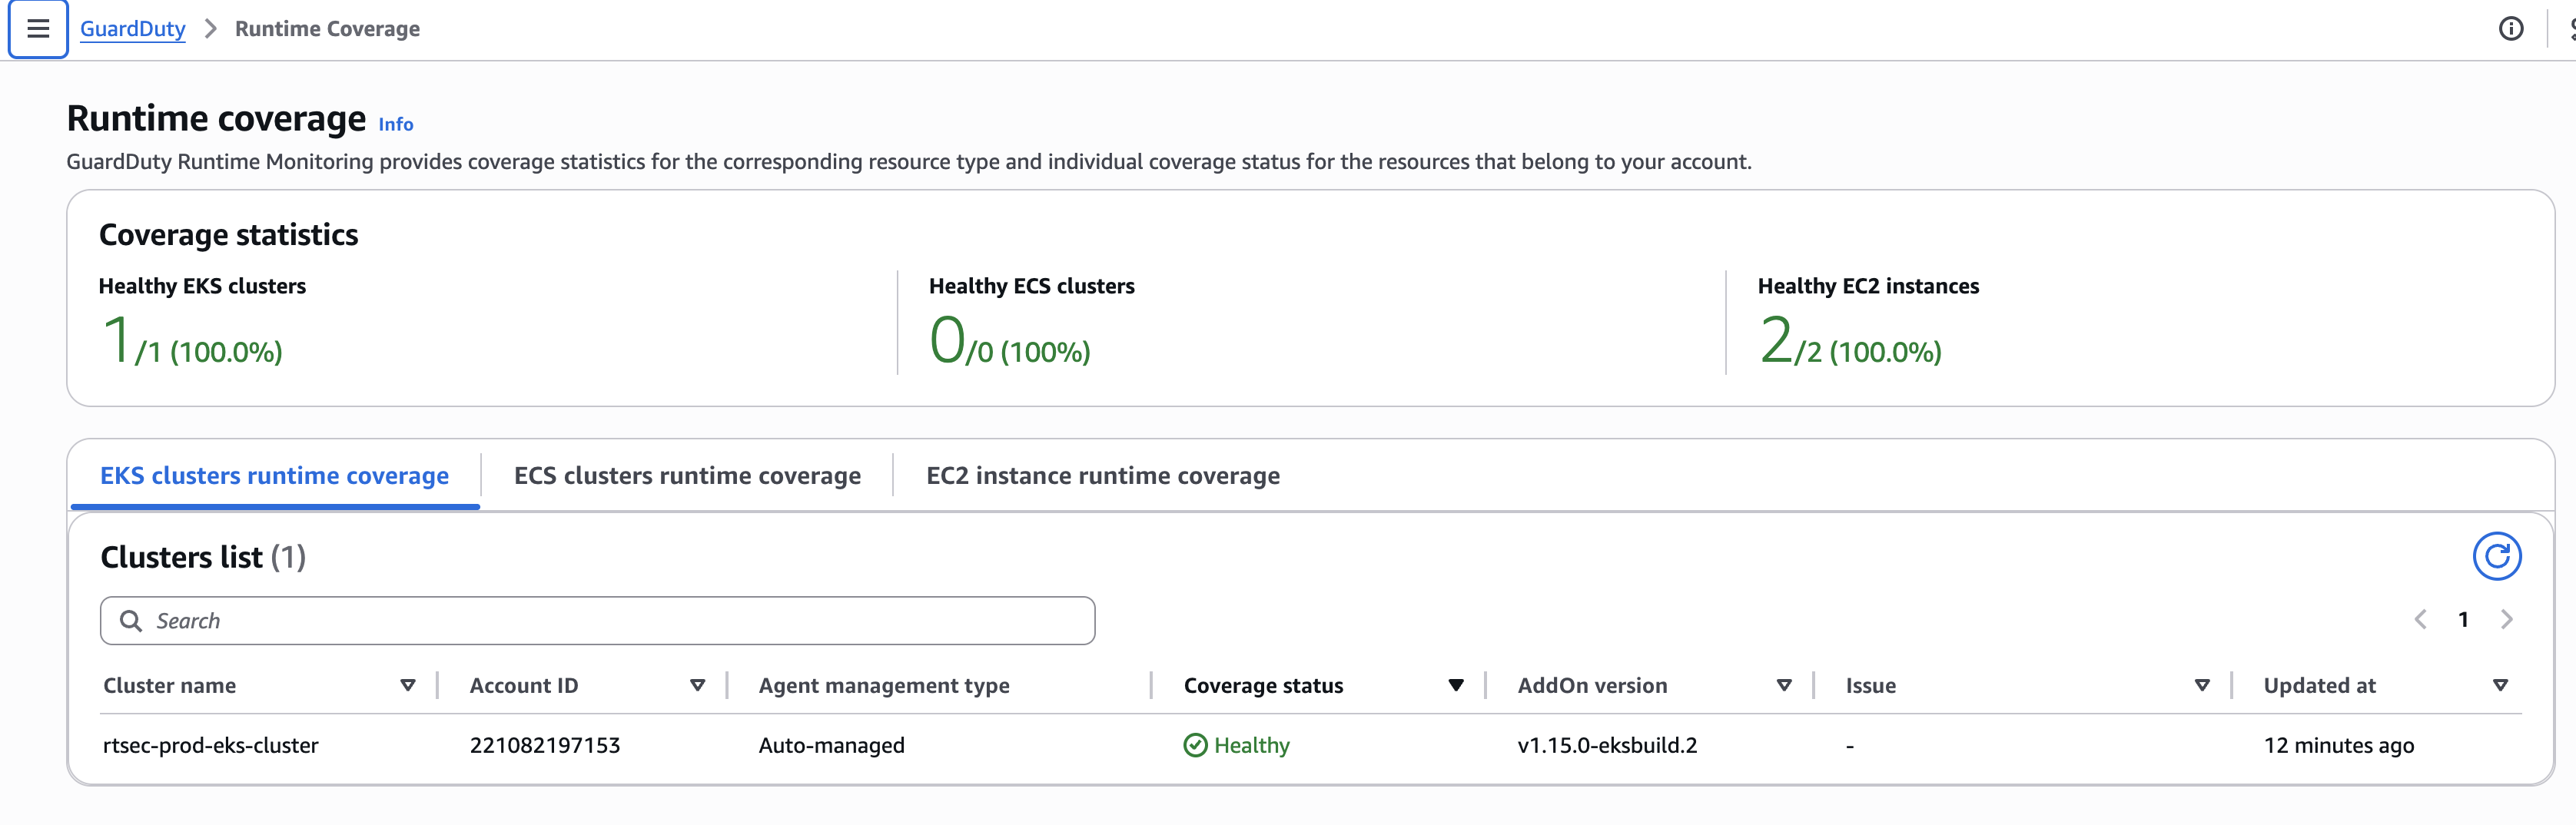
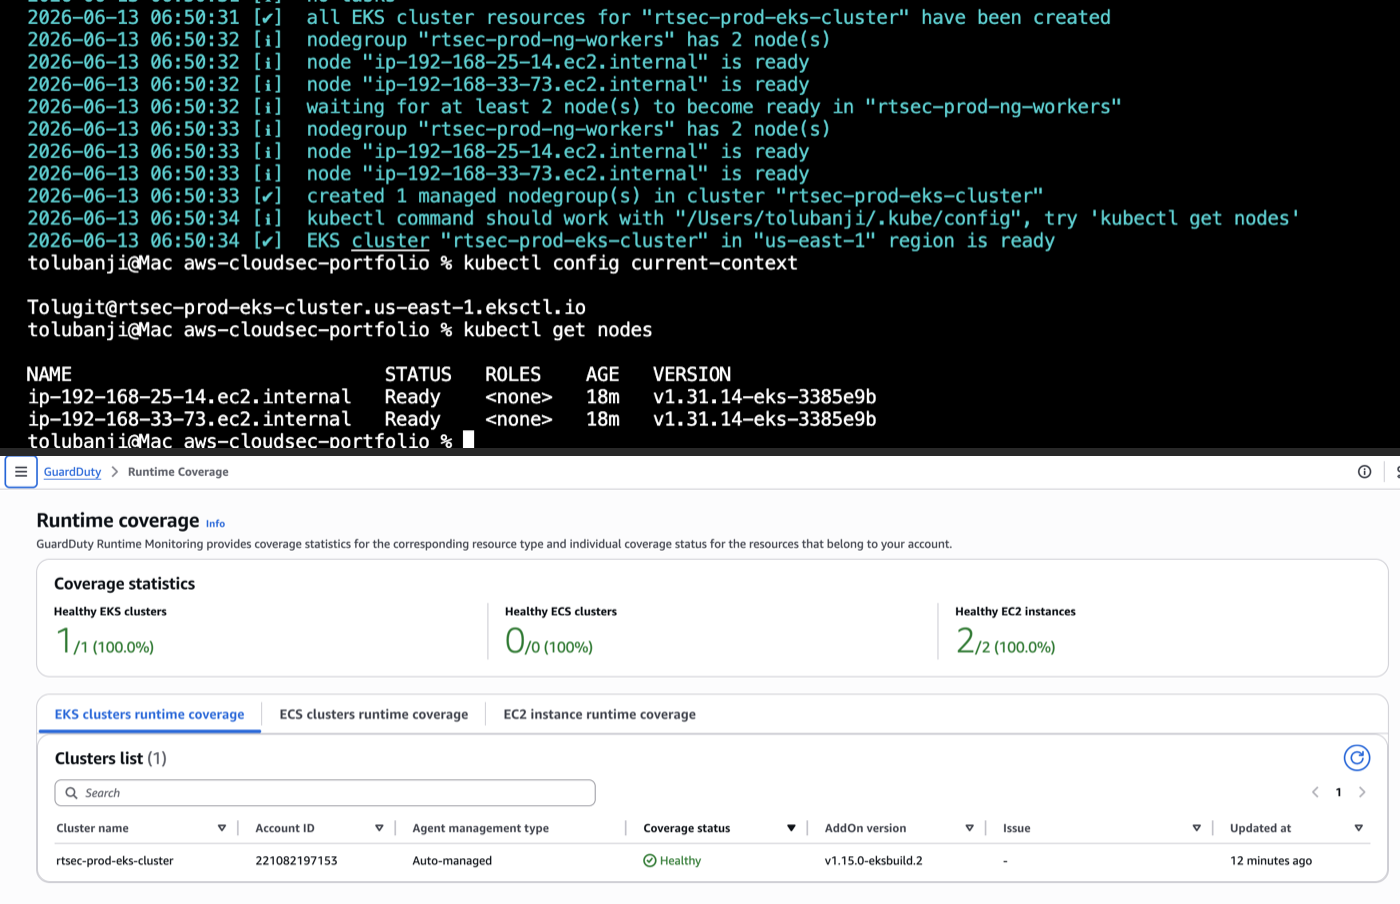
GuardDuty gets enabled before the cluster exists, with EKS Addon Management on. That auto-deploys GuardDuty’s agent DaemonSet the moment a new cluster registers. Order matters: enable GuardDuty after the cluster is up and you must trigger the agent deployment yourself. Enable it beforehand and it appears within minutes, no extra step.
The eksctl config registers the OIDC provider with IAM via withOIDC: true. IRSA needs this later for the Fluent Bit setup. Doing it at cluster creation ties it to a concrete step instead of leaving it as a forgettable afterthought.
apiVersion: eksctl.io/v1alpha5
kind: ClusterConfig
metadata:
  name: rtsec-prod-eks-cluster
  region: us-east-1
  version: "1.31"
  tags:
    Environment: prod
    Project: aws-runtime-security-ebpf
    Owner: Tolugit
    ManagedBy: eksctl
iam:
  withOIDC: true
cloudWatch:
  clusterLogging:
    enableTypes:
      - api
      - audit
      - authenticator
      - controllerManager
      - scheduler
managedNodeGroups:
  - name: rtsec-prod-ng-workers
    instanceType: t3.medium
    minSize: 2
    maxSize: 2
    desiredCapacity: 2
    amiFamily: AmazonLinux2023
    iam:
      attachPolicyARNs:
        - arn:aws:iam::aws:policy/AmazonEKSWorkerNodePolicy
        - arn:aws:iam::aws:policy/AmazonEC2ContainerRegistryReadOnly
        - arn:aws:iam::aws:policy/AmazonSSMManagedInstanceCore
      withAddonPolicies:
        cloudWatch: true
First run failed with Duplicate key(s) in resource tags: [Name] and rolled back the CloudFormation stack. eksctl auto-injects a Name tag into cluster and node group resources, and I had also specified Name manually in the tags section. Two identical keys in the same CloudFormation resource trigger an immediate rollback. Remove any manual Name tags, let eksctl handle them, and delete the failed stack before retrying.

Installing Tetragon and Falco
Tetragon installs as a standalone DaemonSet in kube-system and doesn’t require Cilium CNI. Enforcement comes entirely from the eBPF programs, not the network data plane. Replacing VPC CNI with Cilium would mean a full node group rebuild and a second operational domain, for no security benefit here.
helm repo add cilium https://helm.cilium.io/
helm install tetragon cilium/tetragon \
  --namespace kube-system \
  --set tetragonOperator.enabled=true \
  --set tetragon.exportFilename="/var/run/cilium/tetragon/tetragon.log" \
  --wait
tetragonOperator.enabled=true is required: the operator manages the TracingPolicy CRDs. Without it, the CRDs don’t exist and applying any enforcement policy returns no matches for kind TracingPolicyNamespaced. The CRDs use the cilium.io domain, not tetragon. Grep for cilium to find them:
kubectl get crd | grep cilium
# tracingpolicies.cilium.io
# tracingpoliciesnamespaced.cilium.io

For Falco, three flags matter:
helm install falco falcosecurity/falco \
  --namespace falco --create-namespace \
  --set driver.kind=modern_ebpf \
  --set falco.json_output=true \
  --set falco.json_include_output_property=true \
  --set falcosidekick.enabled=false \
  --wait --timeout 5m
driver.kind=modern_ebpf is required on AL2023, as explained above. falco.json_output=true uses snake_case because the Helm chart writes values directly to the Falco config file. The camelCase form falco.jsonOutput=true is silently ignored. If JSON isn’t showing up in CloudWatch, check this first.
falcosidekick.enabled=false is intentional. The bundled falcosidekick (version 2.32.0 in falco chart 9.x) doesn’t implement the Go SDK web identity provider chain. Annotate its service account with an IRSA role ARN and it ignores the annotation, looking for static credentials instead. With none present, every CloudWatch write returns MissingAuthenticationToken. The fix landed in 2.33.0, but the published chart didn’t have it yet. Fluent Bit handles CloudWatch forwarding instead.
Falco to CloudWatch via Fluent Bit and IRSA
Fluent Bit runs as a DaemonSet in the falco namespace. It tails Falco container logs from the node’s /var/log/containers/ path and forwards them to CloudWatch using IRSA credentials on the service account.
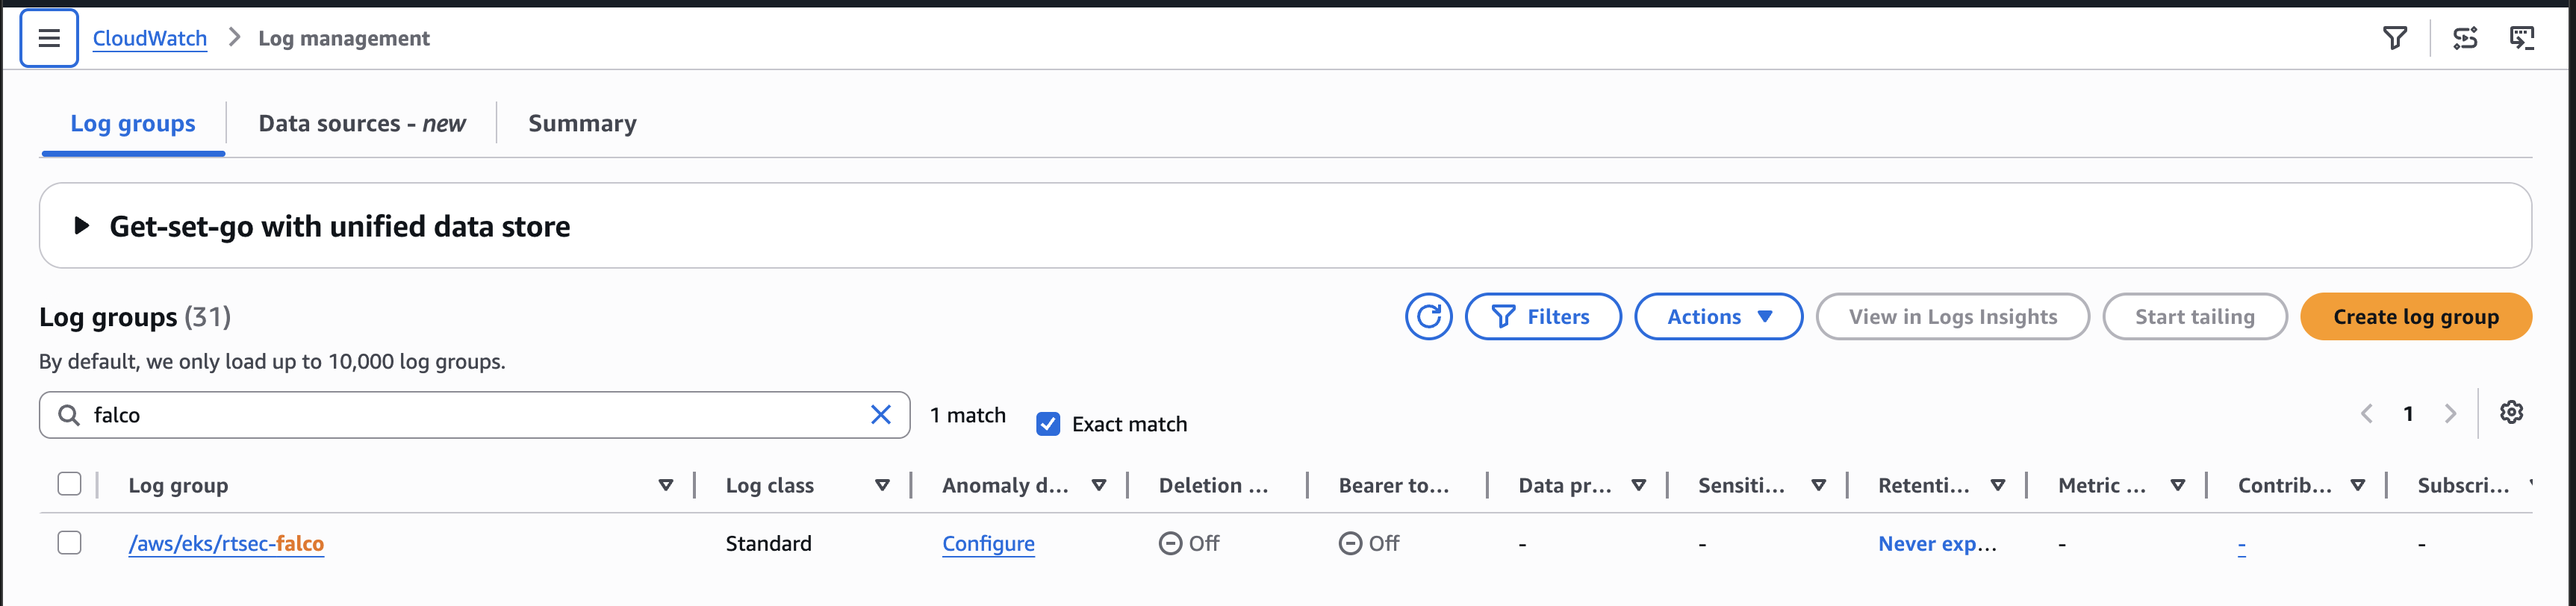
The IAM policy is scoped to /aws/eks/rtsec-falco only:
{
  "Version": "2012-10-17",
  "Statement": [{
    "Effect": "Allow",
    "Action": [
      "logs:CreateLogGroup", "logs:CreateLogStream",
      "logs:PutLogEvents", "logs:DescribeLogStreams"
    ],
    "Resource": [
      "arn:aws:logs:us-east-1:111122223333:log-group:/aws/eks/rtsec-falco",
      "arn:aws:logs:us-east-1:111122223333:log-group:/aws/eks/rtsec-falco:*"
    ]
  }]
}
The IRSA trust policy scopes to the exact service account. The :sub condition must match system:serviceaccount:falco:fluent-bit-falco character for character:
{
  "Version": "2012-10-17",
  "Statement": [{
    "Effect": "Allow",
    "Principal": {
      "Federated": "arn:aws:iam::111122223333:oidc-provider/oidc.eks.us-east-1.amazonaws.com/id/EXAMPLED539D4633E53DE1B71EXAMPLEID"
    },
    "Action": "sts:AssumeRoleWithWebIdentity",
    "Condition": {
      "StringEquals": {
        "oidc.eks.us-east-1.amazonaws.com/id/EXAMPLED539D4633E53DE1B71EXAMPLEID:sub": "system:serviceaccount:falco:fluent-bit-falco",
        "oidc.eks.us-east-1.amazonaws.com/id/EXAMPLED539D4633E53DE1B71EXAMPLEID:aud": "sts.amazonaws.com"
      }
    }
  }]
}
A wrong namespace or service account name produces a silent AccessDenied on every AssumeRoleWithWebIdentity call, surfacing as MissingAuthenticationToken in the Fluent Bit logs. Same symptom as the falcosidekick bug, different root cause.
The Fluent Bit DaemonSet manifest:
---
apiVersion: v1
kind: ServiceAccount
metadata:
  name: fluent-bit-falco
  namespace: falco
  annotations:
    eks.amazonaws.com/role-arn: arn:aws:iam::111122223333:role/rtsec-fluentbit-irsa
---
apiVersion: v1
kind: ConfigMap
metadata:
  name: fluent-bit-falco-config
  namespace: falco
data:
  fluent-bit.conf: |
    [SERVICE]
        Flush         5
        Log_Level     info
        Parsers_File  parsers.conf

    [INPUT]
        Name              tail
        Tag               falco.*
        Path              /var/log/containers/falco-*.log
        Parser            docker
        DB                /var/flb-db/flb_falco.db
        Mem_Buf_Limit     5MB
        Skip_Long_Lines   On
        Refresh_Interval  10

    [FILTER]
        Name    grep
        Match   falco.*
        Regex   log \{

    [OUTPUT]
        Name                cloudwatch_logs
        Match               falco.*
        region              us-east-1
        log_group_name      /aws/eks/rtsec-falco
        log_stream_prefix   falco-
        auto_create_group   true

  parsers.conf: |
    [PARSER]
        Name        docker
        Format      json
        Time_Key    time
        Time_Format %Y-%m-%dT%H:%M:%S.%LZ
---
apiVersion: apps/v1
kind: DaemonSet
metadata:
  name: fluent-bit-falco
  namespace: falco
  labels:
    app: fluent-bit-falco
spec:
  selector:
    matchLabels:
      app: fluent-bit-falco
  template:
    metadata:
      labels:
        app: fluent-bit-falco
    spec:
      serviceAccountName: fluent-bit-falco
      containers:
        - name: fluent-bit
          image: cr.fluentbit.io/fluent/fluent-bit:3.2
          resources:
            requests: { cpu: 50m, memory: 64Mi }
            limits: { cpu: 100m, memory: 128Mi }
          volumeMounts:
            - { name: config, mountPath: /fluent-bit/etc }
            - { name: varlog, mountPath: /var/log, readOnly: true }
            - { name: varlibdockercontainers, mountPath: /var/lib/docker/containers, readOnly: true }
            - { name: flb-db, mountPath: /var/flb-db }
      volumes:
        - { name: config, configMap: { name: fluent-bit-falco-config } }
        - { name: varlog, hostPath: { path: /var/log } }
        - { name: varlibdockercontainers, hostPath: { path: /var/lib/docker/containers } }
        - { name: flb-db, emptyDir: {} }
The emptyDir for the position DB is necessary because /var/log is mounted read-only from the host. Placing the DB at /var/log/flb_falco.db fails on startup with cannot open database. The writable emptyDir at /var/flb-db solves this.
The GREP filter (Regex log \{) drops Falco startup messages and driver load lines before they reach CloudWatch, so the log group holds only alert JSON.
Fluent Bit stores events as {"log":"<CRI-line>"}, where the CRI line is timestamp stdout F {falco-json}. CloudWatch Insights queries need to reach through both wrappers to parse the inner Falco fields.
Tetragon Enforcement Policies
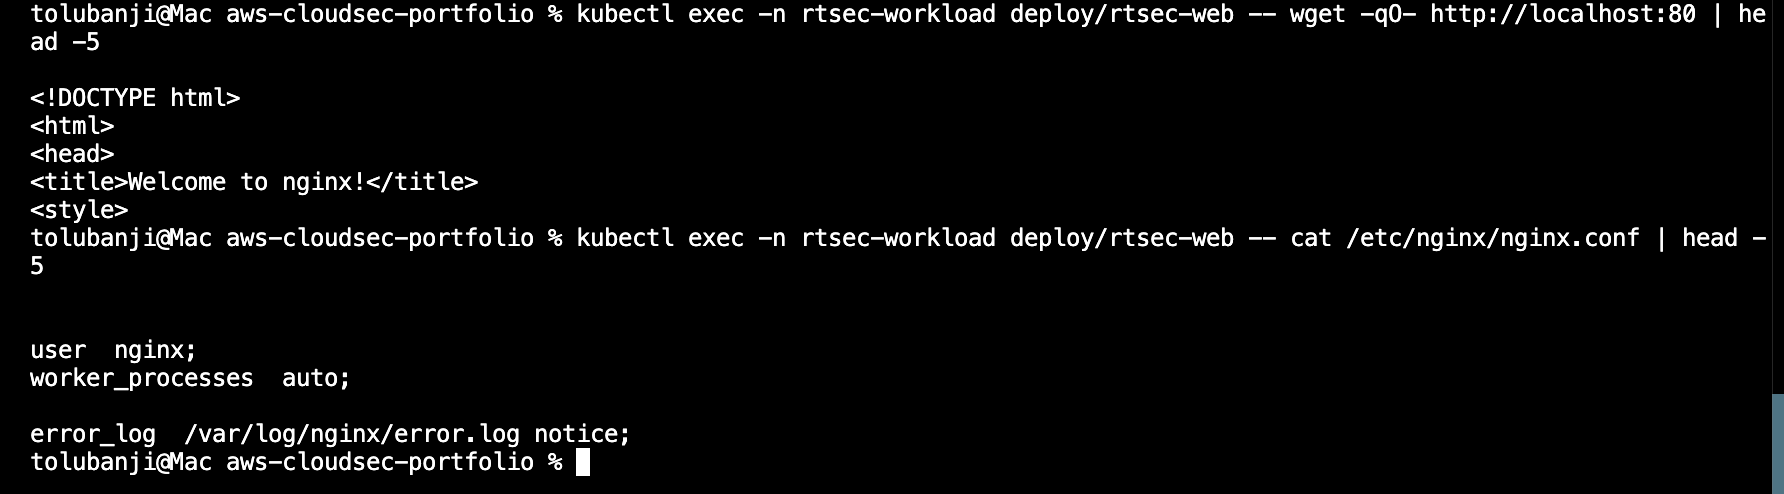
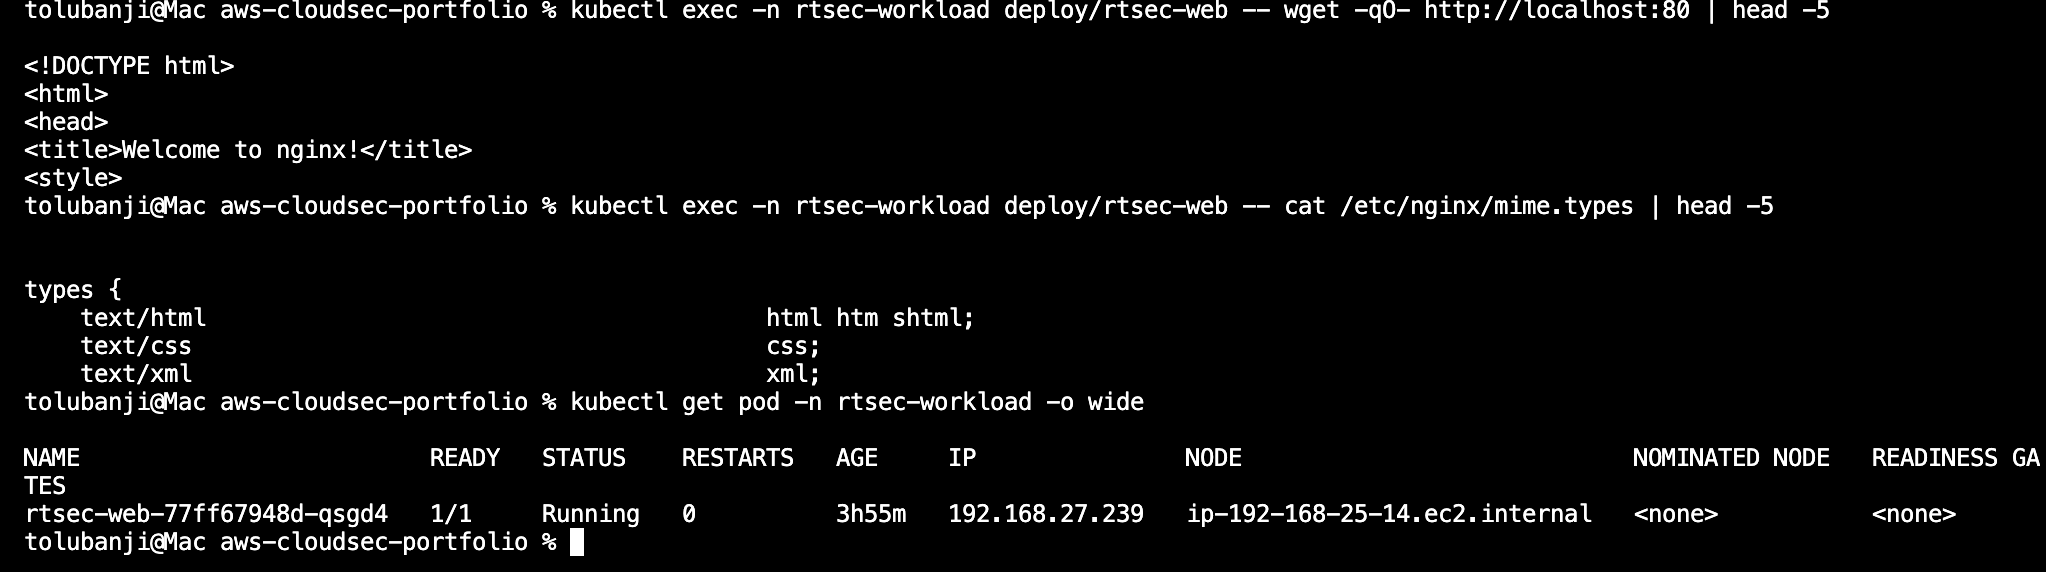
Before writing any TracingPolicy, the workload needs to be running and serving normally. With Tetragon and Falco active but no policies applied, nginx returns HTML, config files read cleanly, and tetra tracingpolicy list shows an empty list.

Blocking Sensitive File Reads
The first policy kills any process that opens /etc/shadow inside the rtsec-workload namespace.
The critical choice is CRD type. Do not use matchNamespaces inside a regular TracingPolicy to scope by Kubernetes namespace: it refers to Linux kernel namespace types (Pid, Net, Mnt), not Kubernetes namespaces. Passing a Kubernetes namespace name there returns matchNamespaces[0].namespace: Required value.
The correct mechanism is TracingPolicyNamespaced, deployed into the target Kubernetes namespace. Tetragon scopes it automatically to pods in that namespace. The scoping is structural, not conditional.
apiVersion: cilium.io/v1alpha1
kind: TracingPolicyNamespaced
metadata:
  name: block-sensitive-file-reads
  namespace: rtsec-workload
spec:
  kprobes:
  - call: "security_file_open"
    syscall: false
    args:
    - index: 0
      type: "file"
    selectors:
    - matchArgs:
      - index: 0
        operator: "Prefix"
        values:
        - "/etc/shadow"
      matchActions:
      - action: Sigkill
      - action: Post
security_file_open is a kernel security hook that fires on every file open attempt. Post sends the event to the Tetragon export stream without taking further action. Combined with Sigkill, it kills the process and records the event.
The first version of this policy also blocked /etc/passwd. Every command in the workload container immediately returned exit 137, including cat /etc/nginx/nginx.conf and wget http://localhost:80. The reason: musl libc on Alpine calls getpwuid() at process startup to resolve the current user, and getpwuid() opens /etc/passwd. Blocking it kills every process before it can do anything. /etc/shadow is the correct target: it stores password hashes and has no legitimate read path from user processes under normal operation.
With the corrected policy applied:

kubectl exec -n rtsec-workload deploy/rtsec-web -- sh -c "cat /etc/shadow"
# command terminated with exit code 137

kubectl exec -n rtsec-workload deploy/rtsec-web -- cat /etc/nginx/nginx.conf | head -3
# user  nginx;
# worker_processes  auto;
# ...
Exit code 137 = 128 + signal 9. SIGKILL hit the cat process inside the kernel BPF hook before open() returned. The nginx config reads fine because the policy only matches /etc/shadow.
Blocking Shell Exec
A compromised container that can spawn a shell is one an attacker can operate interactively. This policy kills any sh, bash, or ash process spawned inside rtsec-workload.

apiVersion: cilium.io/v1alpha1
kind: TracingPolicyNamespaced
metadata:
  name: block-shell-exec
  namespace: rtsec-workload
spec:
  kprobes:
  - call: "sys_execve"
    syscall: true
    args:
    - index: 0
      type: "string"
    selectors:
    - matchArgs:
      - index: 0
        operator: "Postfix"
        values:
        - "/bin/sh"
        - "/bin/bash"
        - "/bin/ash"
        - "/usr/bin/sh"
        - "/usr/bin/bash"
      matchActions:
      - action: Sigkill
      - action: Post
Postfix matches any executable path ending with the specified string, catching /bin/sh and symlink paths like /usr/local/bin/sh without enumerating every location.
This policy proves the mechanism. The NENFORCE counter proves it fires. It is not production-grade enforcement on its own. String-based Postfix matching has known gaps: argv[0] manipulation, statically-linked interpreters, execveat instead of execve, busybox applets invoked from an unexpected path. In production you’d layer this with additional selectors and accept that name-based matching is one layer of a defense-in-depth stack, not a complete control. The GuardDuty section later uses cp /bin/busybox /tmp/xmrig to sidestep this exact policy, a live demonstration of that gap.
kubectl exec -n rtsec-workload deploy/rtsec-web -- sh -c "echo should-not-run"
# command terminated with exit code 137

kubectl exec -n rtsec-workload deploy/rtsec-web -- wget -qO- http://localhost:80 | head -3
# <!DOCTYPE html>...
The sh process was killed before echo ran, so there’s no output. The nginx workload keeps serving traffic. Both policies stayed active, with the workload pod at zero restarts across all test runs.

Enforcement Counters
tetra getevents streams live events only and can’t show historical enforcement decisions. For proof that policies fired, use tetra tracingpolicy list. The NENFORCE column counts how many processes each policy killed since the DaemonSet started.
TPOD=$(kubectl get pod -n kube-system -l app.kubernetes.io/name=tetragon \
  --field-selector spec.nodeName=$(kubectl get pod -n rtsec-workload \
  -l app=rtsec-web -o jsonpath='{.items[0].spec.nodeName}') \
  -o jsonpath='{.items[0].metadata.name}')

kubectl exec -n kube-system $TPOD -c tetragon -- tetra tracingpolicy list
ID NAME STATE NAMESPACE MODE NENFORCE
3 block-sensitive-file-reads enabled rtsec-workload enforce 6
4 block-shell-exec enabled rtsec-workload enforce 4NENFORCE=6 on the sensitive file policy, NENFORCE=4 on the shell exec policy. Each increment is one process that violated the policy and was killed inside the kernel BPF hook before the syscall completed.
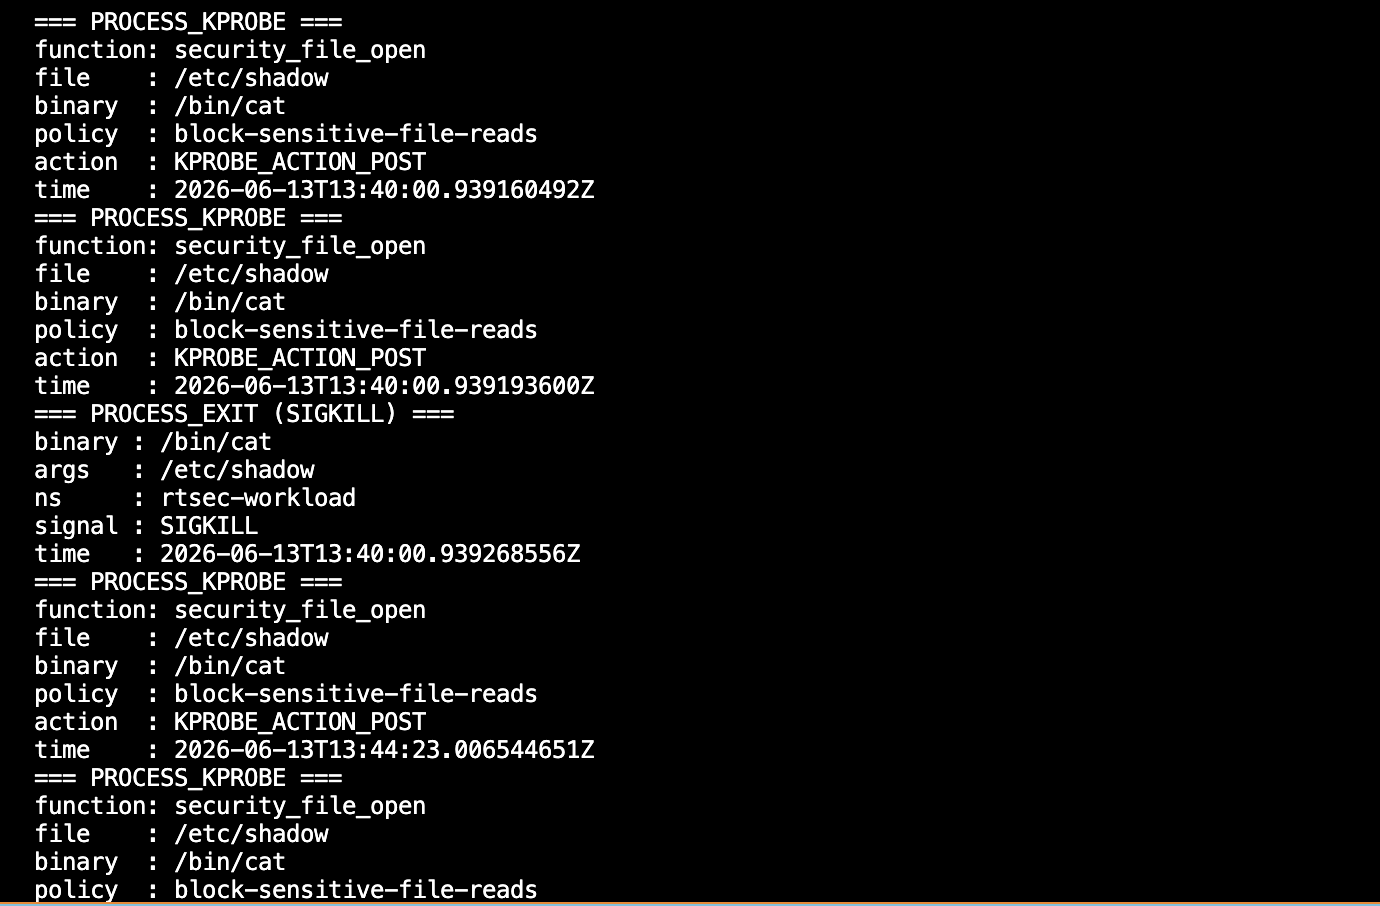
Falco Correlated Detection
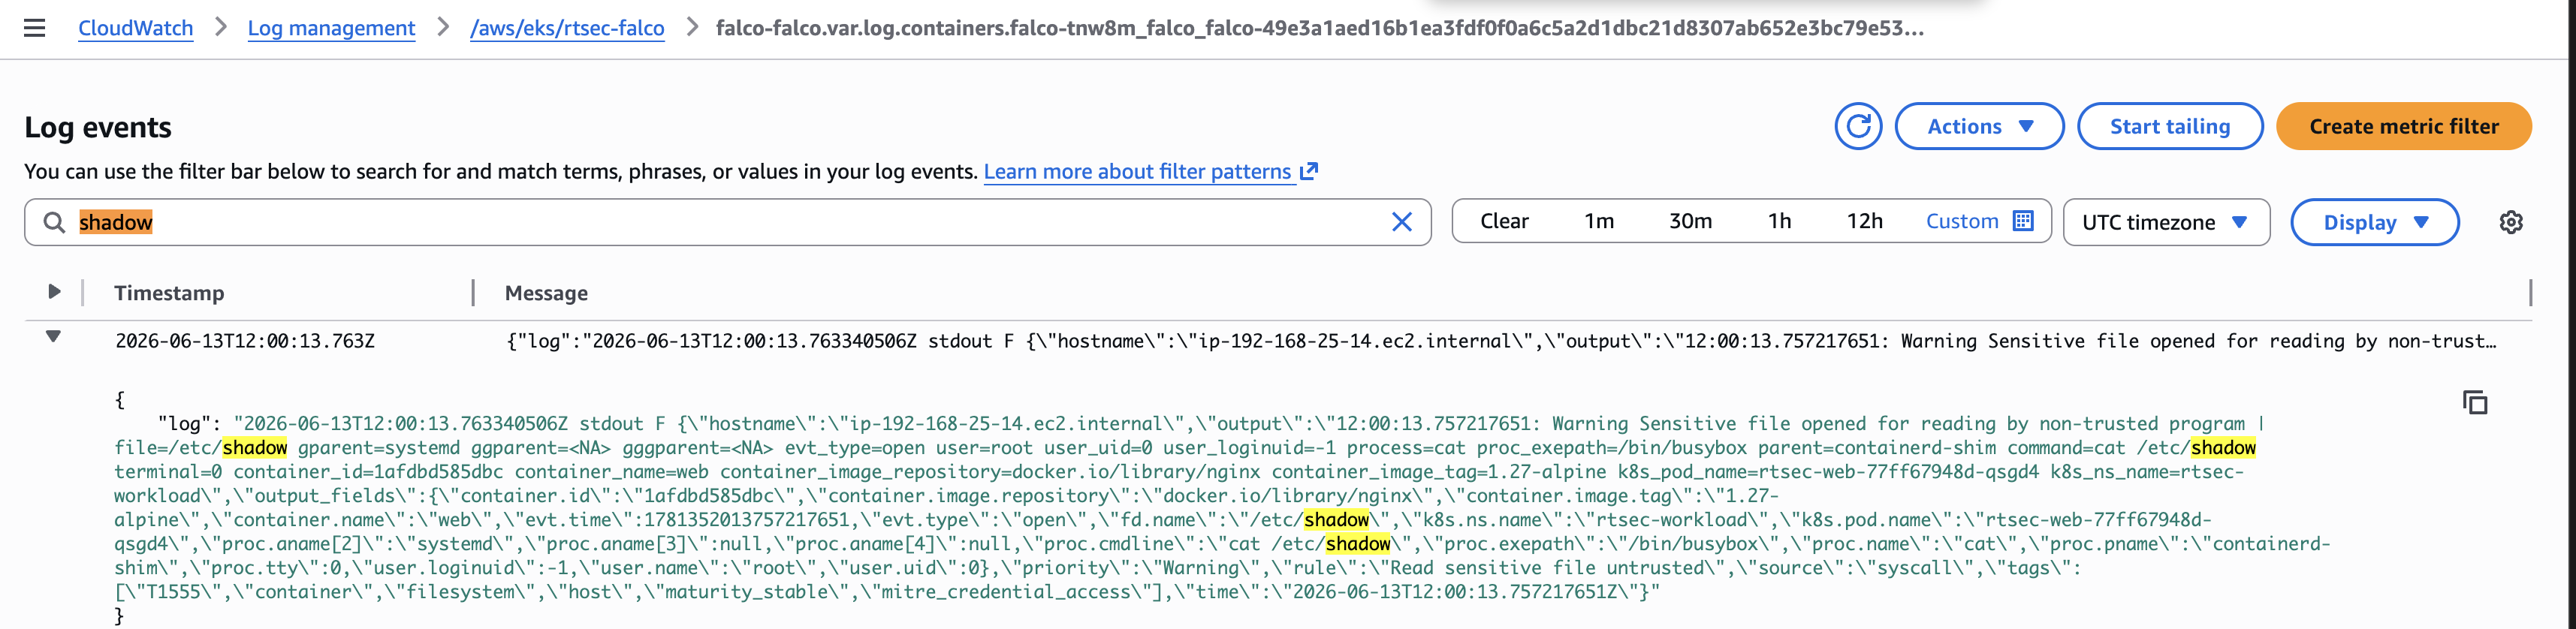
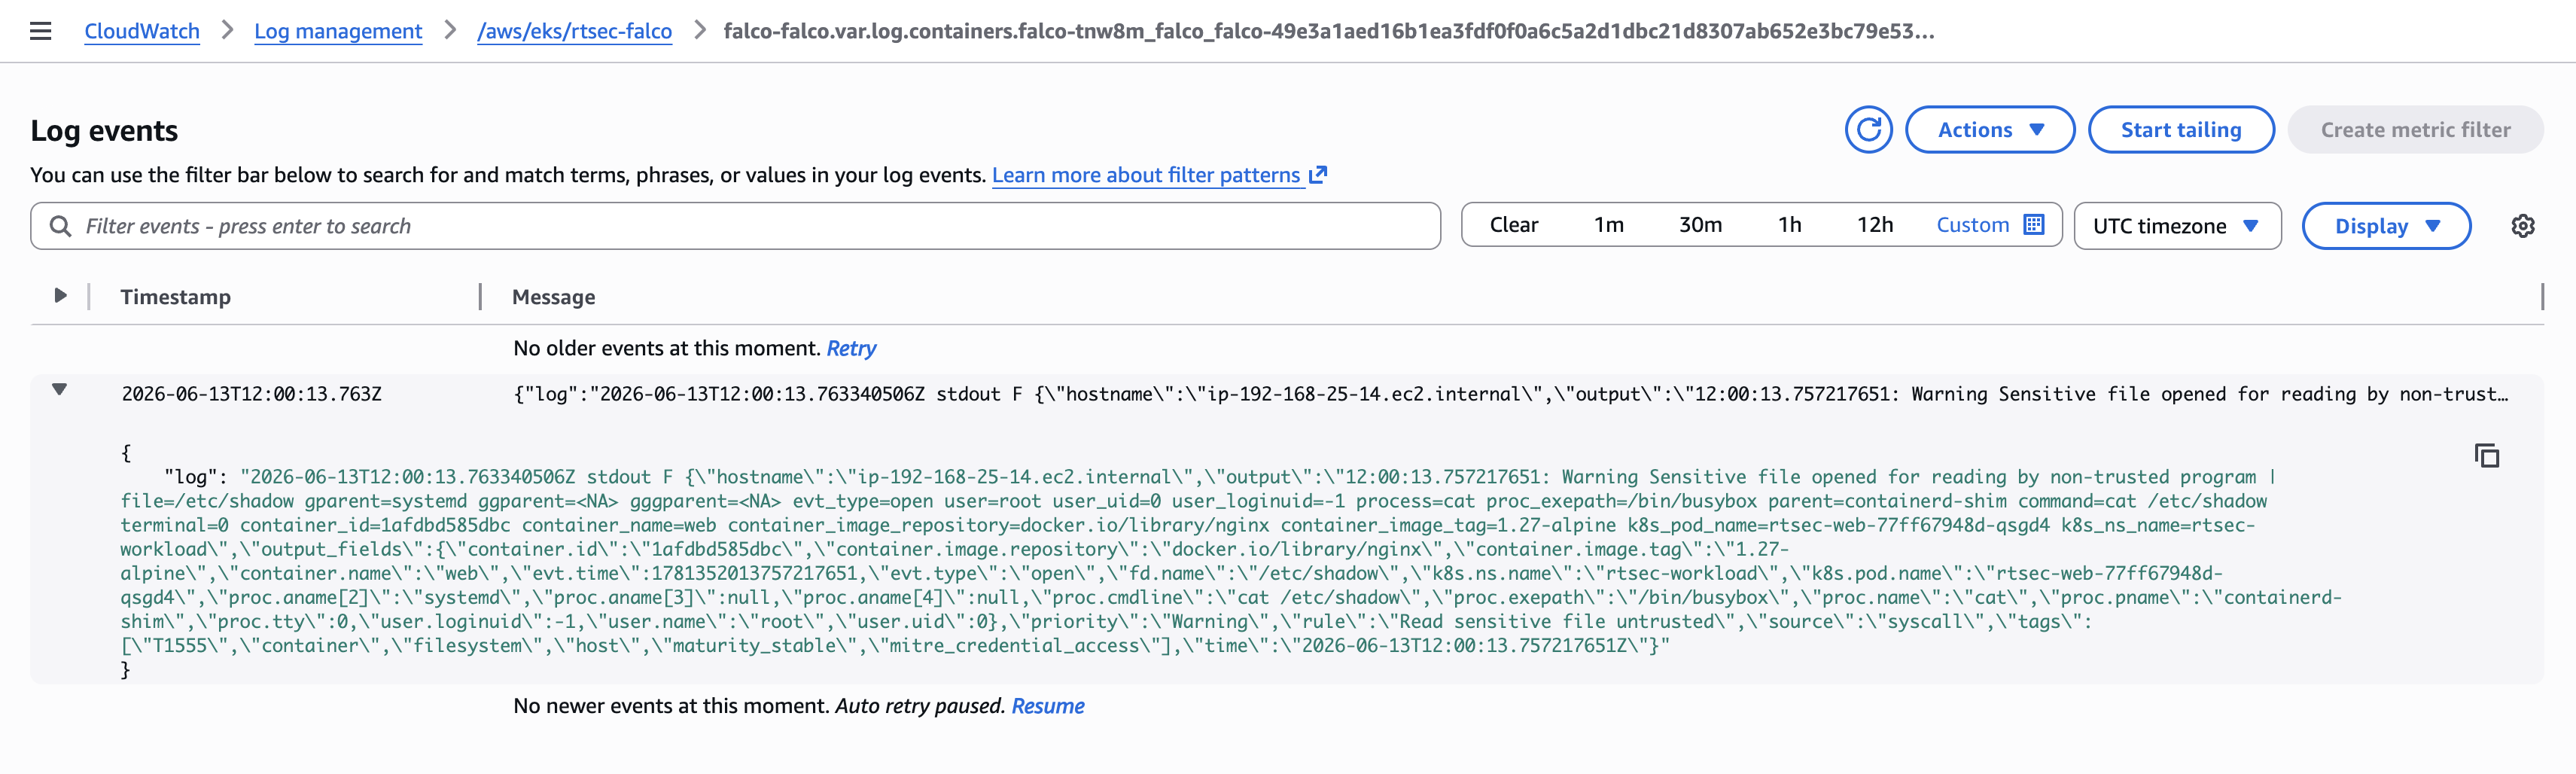
While Tetragon killed the cat /etc/shadow process, Falco independently observed the same syscall attempt via its own kernel hook. The Read sensitive file untrusted rule fired, and the alert appeared in CloudWatch /aws/eks/rtsec-falco with a timestamp matching the Tetragon kill event.
Both layers recorded the same event from independent hooks. Tetragon prevented the action; Falco generated the alert and audit trail. If Tetragon’s policy had a gap, Falco would still fire, and the CloudWatch record is queryable and structured for later investigation.
ECR, Image Provenance, and the Audit Trail
The workload initially ran the public nginx:1.27-alpine image from Docker Hub. Phase 4 pushes a tagged image to ECR with scan-on-push enabled, redeploys from the private registry, and verifies enforcement survives the swap.
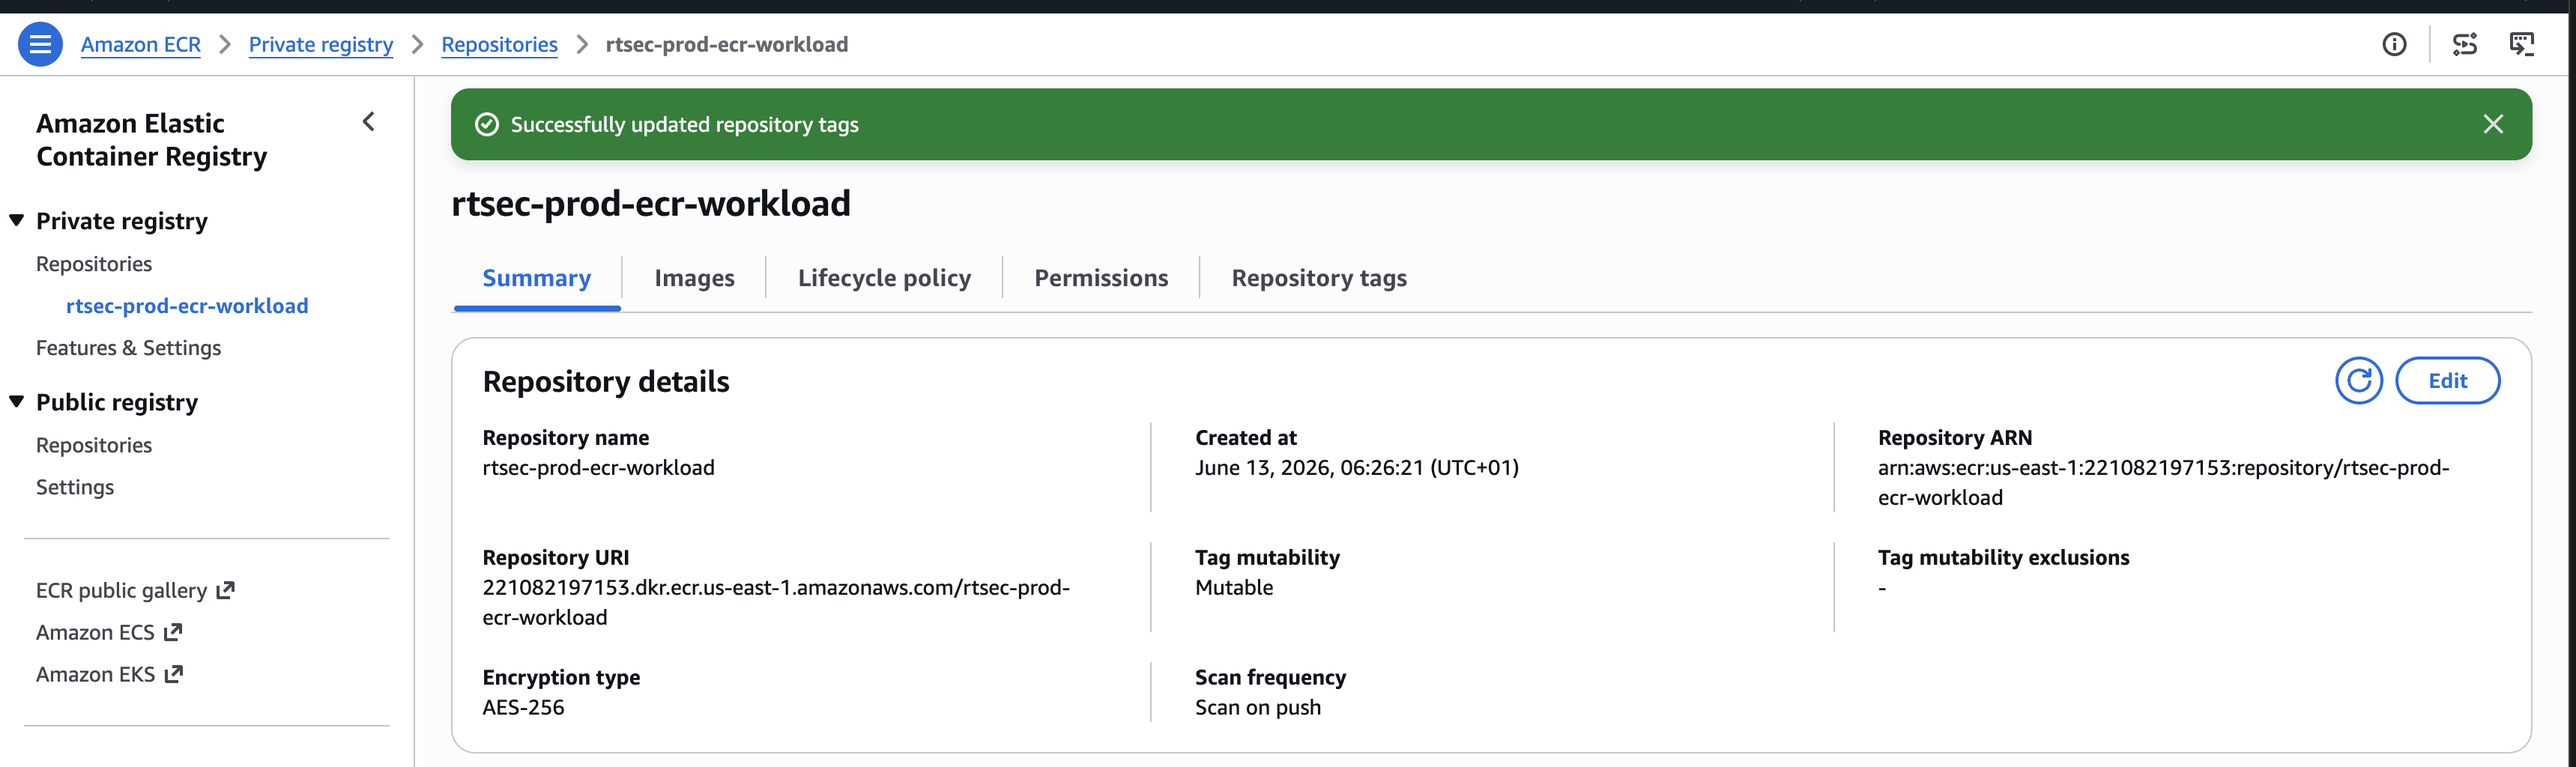
Building on an Apple Silicon Mac without --platform linux/amd64 produces an ARM64 image, but the EKS nodes here are x86_64. The image pushes to ECR without error, but the pods fail at container start with ImagePullBackOff: no match for platform in manifest. Always specify the platform when targeting amd64 EKS nodes from Apple Silicon:
docker buildx build \
  --platform linux/amd64 \
  -t 111122223333.dkr.ecr.us-east-1.amazonaws.com/rtsec-prod-ecr-workload:v1.0 \
  -f /tmp/Dockerfile.rtsec /tmp/ --push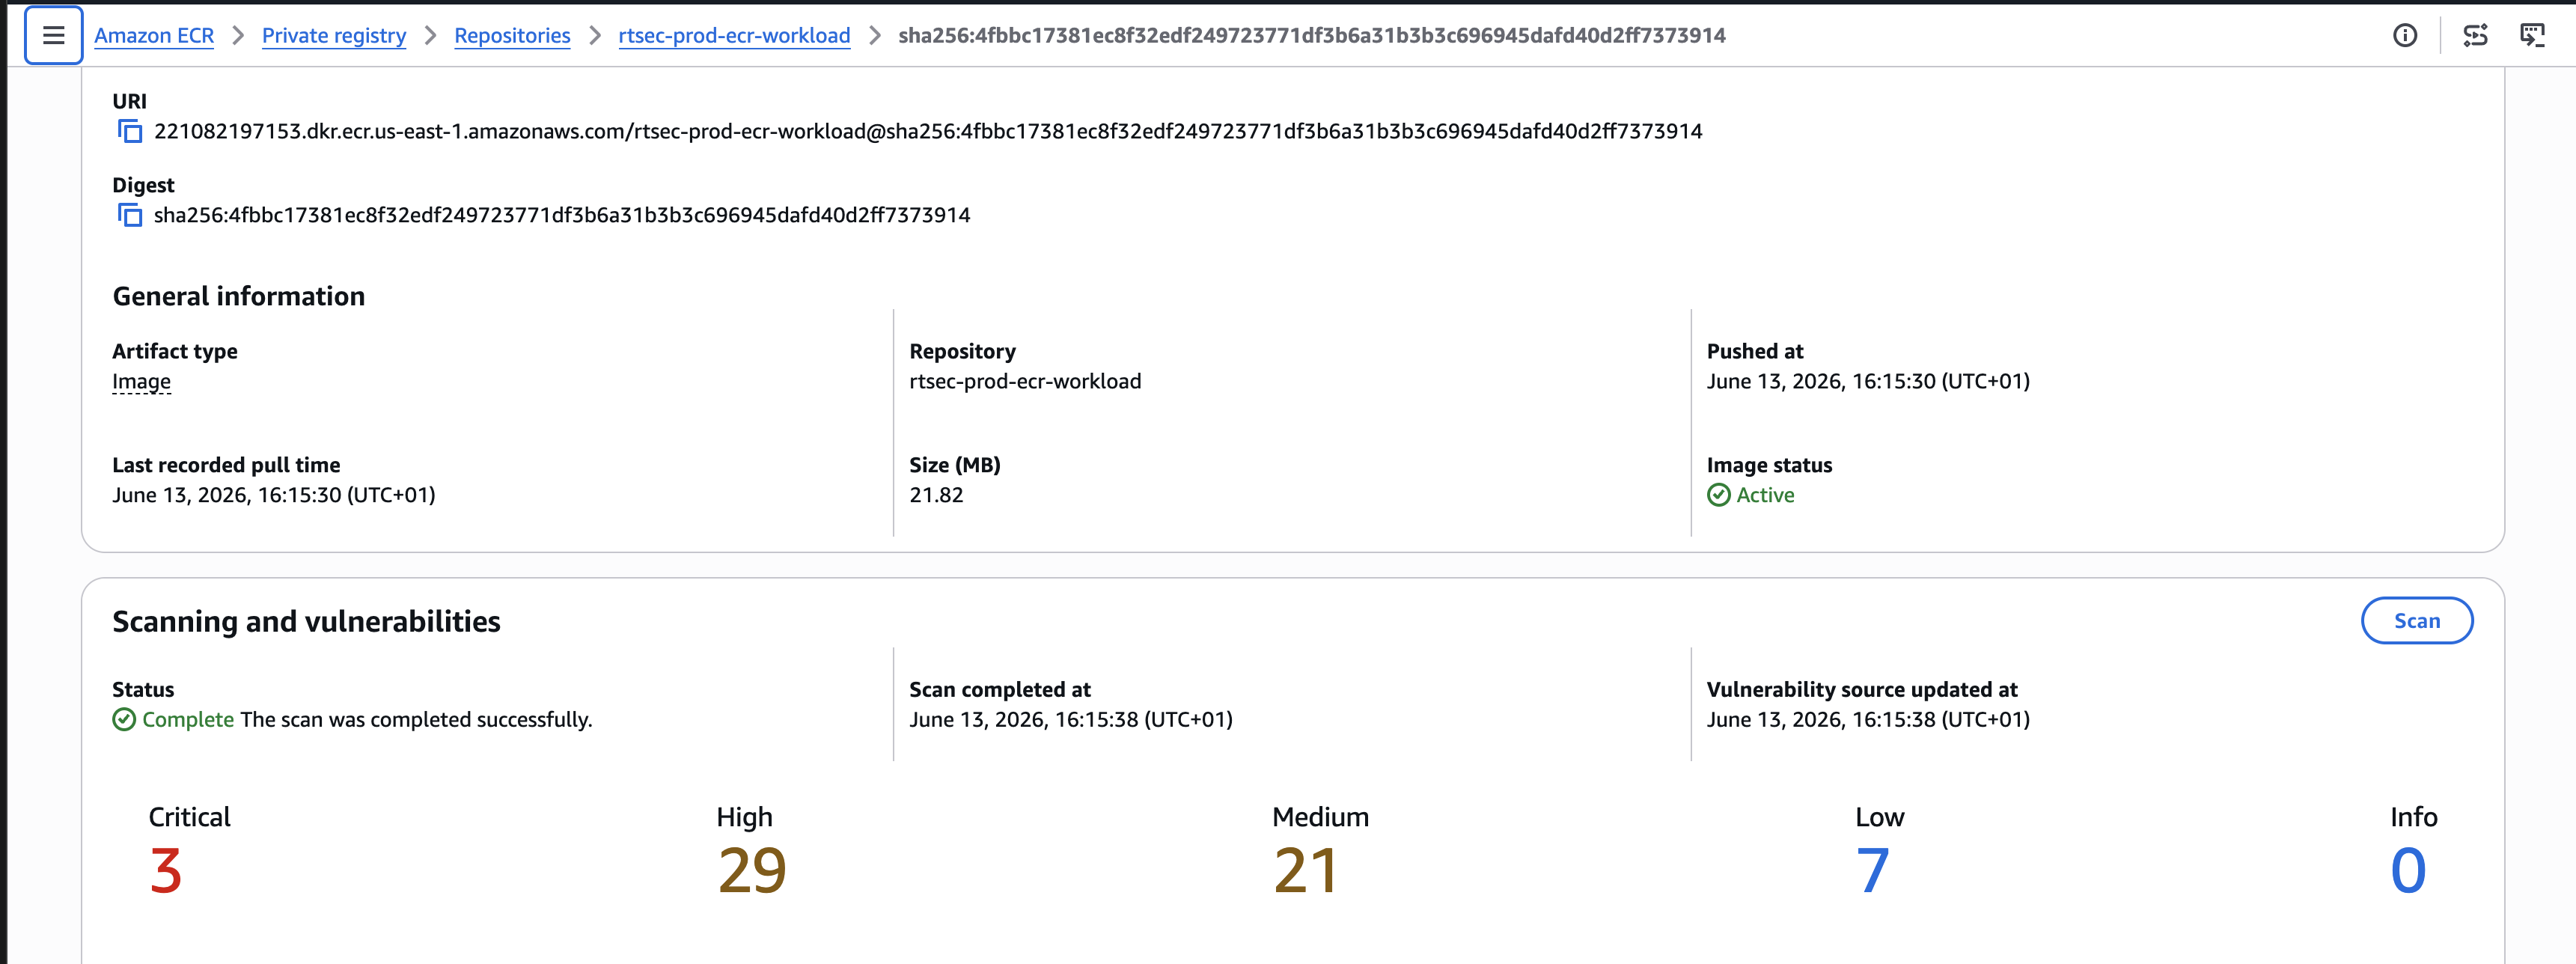
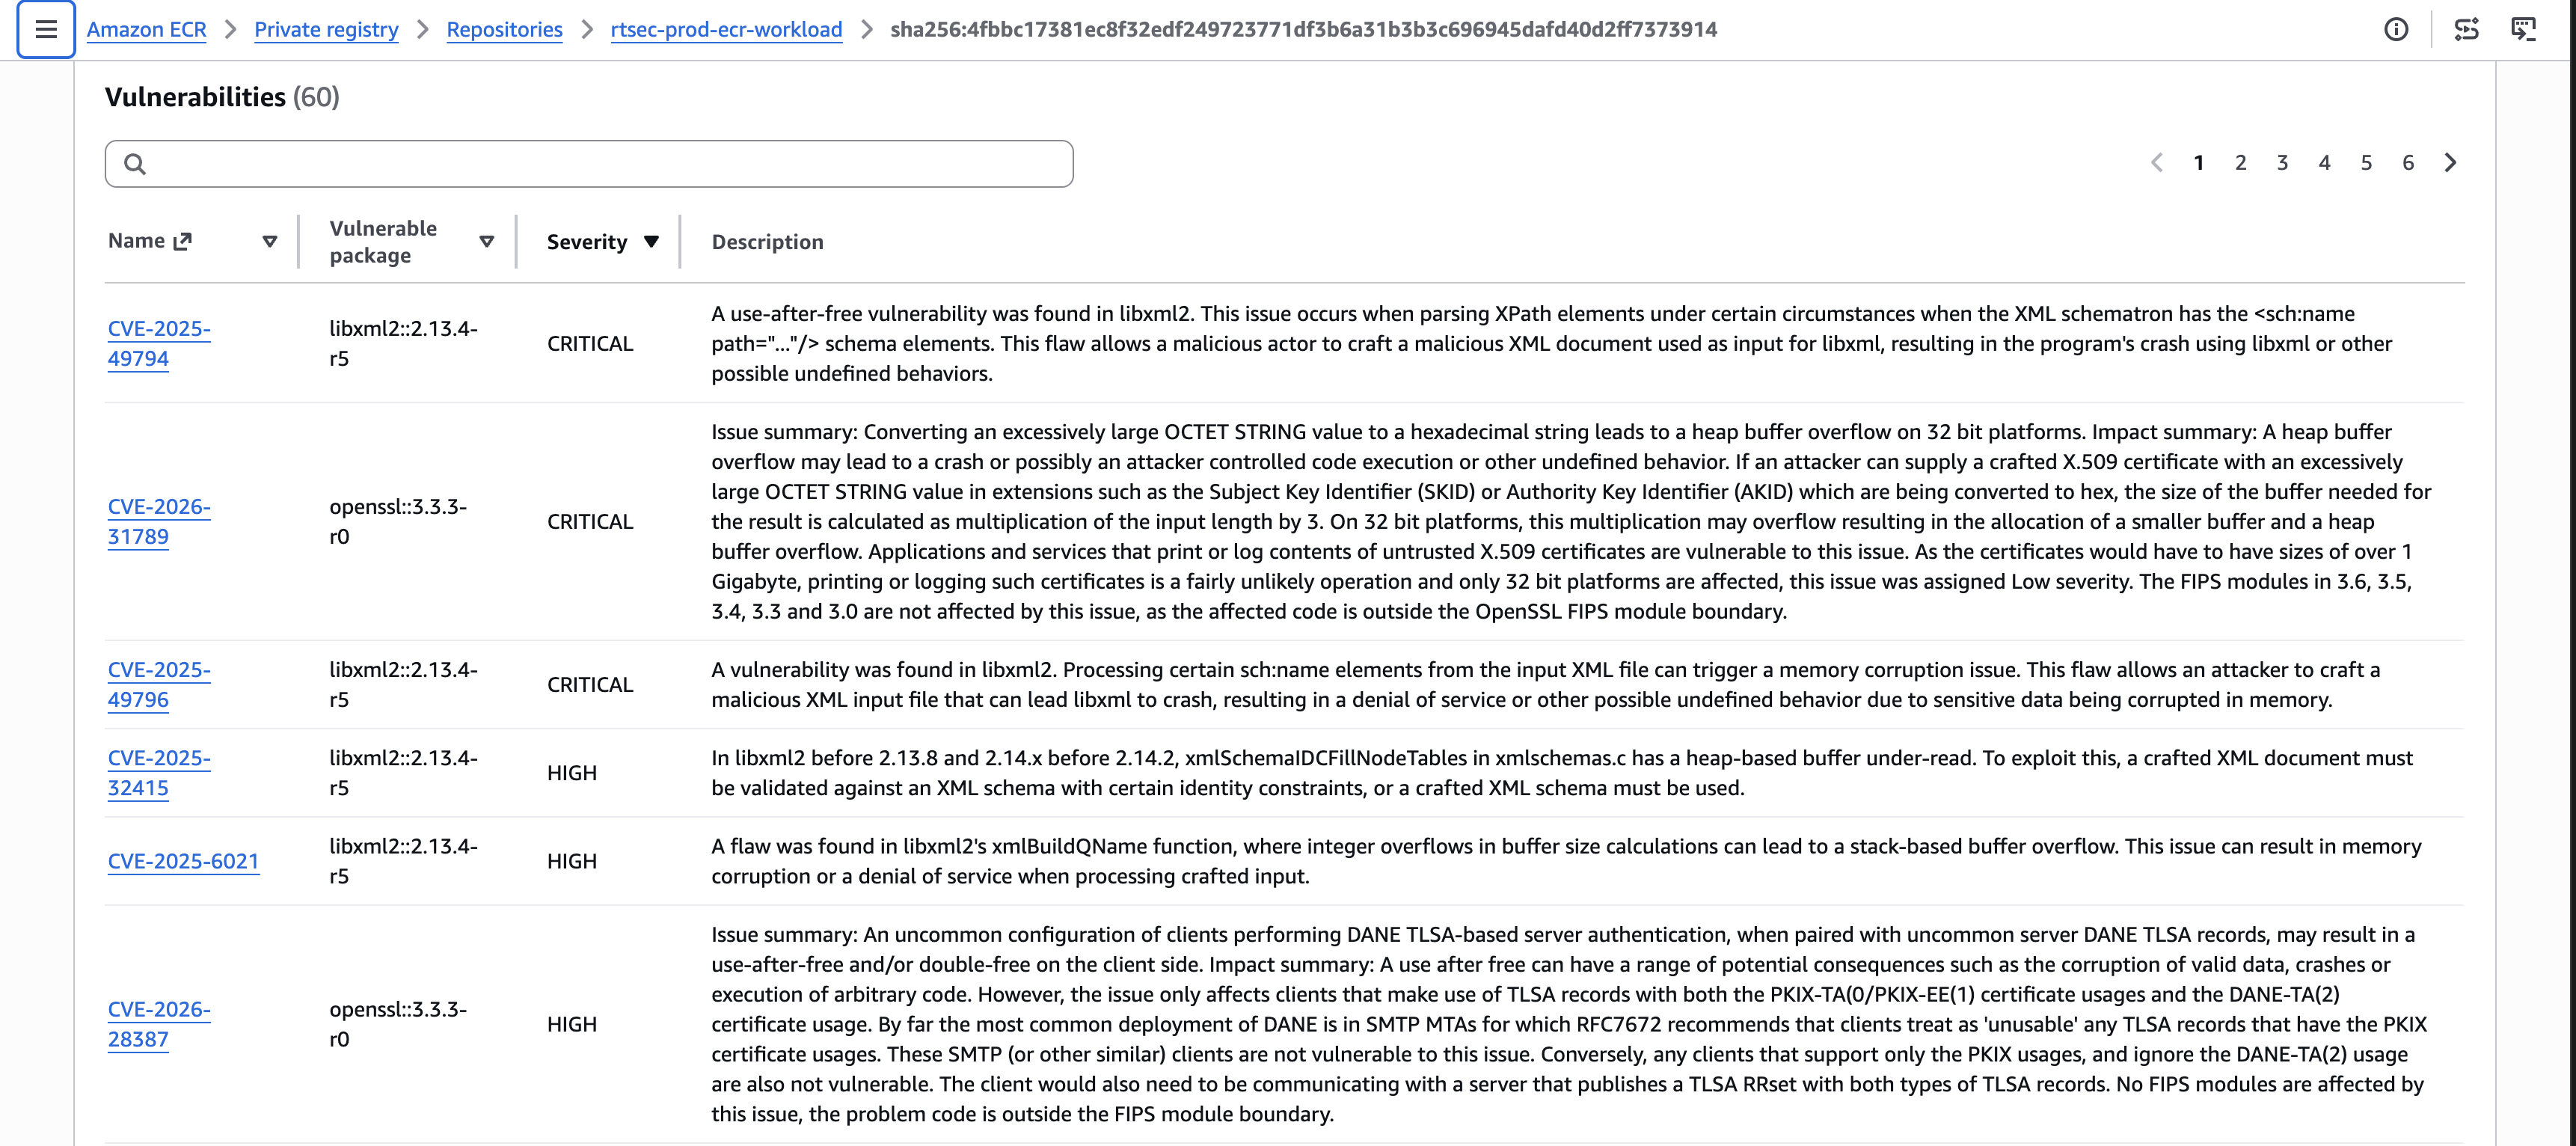
The scan completed with Critical=3, High=29, Medium=21, Low=7. Not zero, but expected for a current Alpine-based nginx build given the CVE backlog in Alpine packages and openssl. Scan-on-push checks every new image automatically, with no manual step.
After redeploying from the ECR URI, Tetragon enforcement is still active on the new pod:
kubectl exec -n rtsec-workload deploy/rtsec-web -- sh -c "cat /etc/shadow"
# command terminated with exit code 137
TracingPolicyNamespaced scopes to the Kubernetes namespace, not the container image. When the new pod starts in rtsec-workload, Tetragon applies the policies immediately. The image swap changes nothing about enforcement.
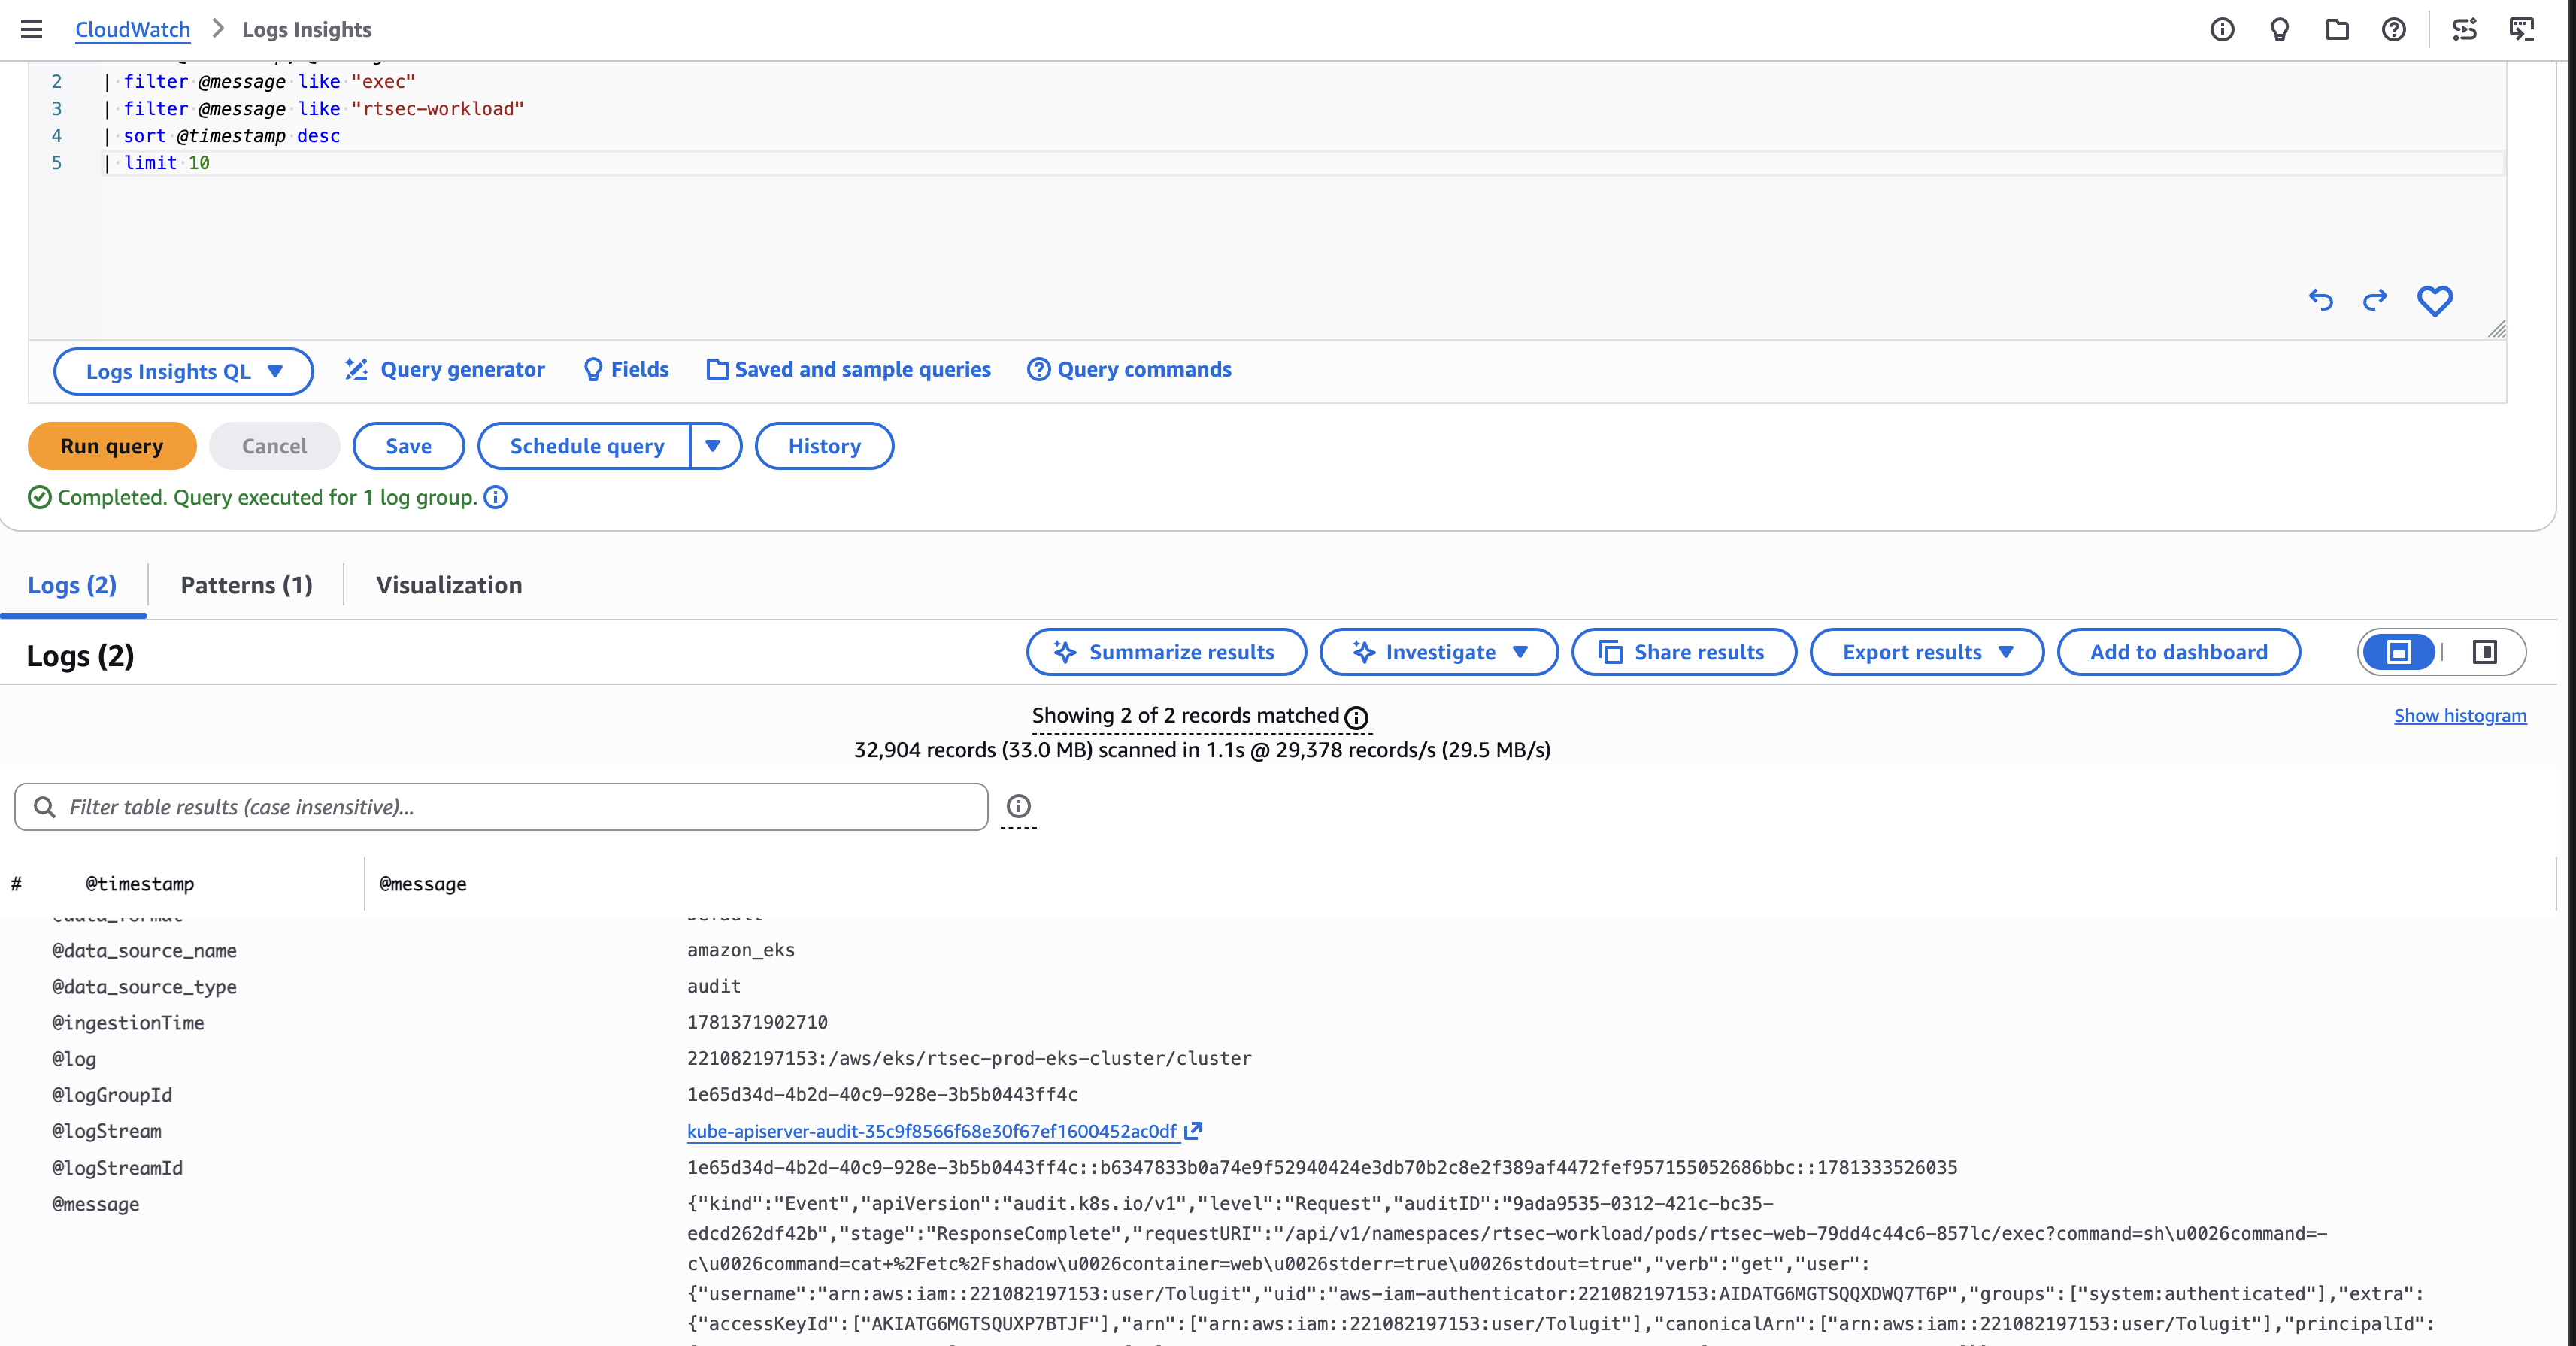
Every kubectl exec call during Phase 3 also created a Kubernetes audit event in CloudWatch under /aws/eks/rtsec-prod-eks-cluster/cluster. EKS logs these as HTTP GET requests to the pod’s exec subresource: get maps to the HTTP method of the WebSocket upgrade request kubectl exec makes to the API server.
fields @timestamp, @message
| filter @message like "exec"
| filter @message like "rtsec-workload"
| sort @timestamp desc
| limit 10
This is the API-layer record of every test run: three independent records of the same events. Tetragon killed the process at the kernel level, Falco alerted at the container level, and the audit log recorded the API call that started the exec.
GuardDuty Runtime Findings
The first approach to generating GuardDuty Runtime findings was DNS: nslookup pool.minergate.com from inside the workload pod, a known-bad domain that should trigger a DNS-based detection rule. Zero findings after 15 minutes.
GuardDuty only processes DNS logs from the default VPC DNS resolver. Pods use kube-dns (CoreDNS), which routes pod DNS queries without going through that resolver, so GuardDuty never sees them. This is documented but not prominently, and it’s the first thing that trips people up testing GuardDuty from Kubernetes workloads.
Execution-based triggers work instead: the GuardDuty Runtime Monitoring agent observes kernel-level execve events directly from the node. A binary named xmrig executing from /tmp matches GuardDuty’s threat intelligence feed at the syscall level, before any network activity occurs.
Three triggers, three findings. Remove the shell exec policy first, since all triggers use sh -c:
kubectl delete tracingpolicynamespaced block-shell-exec -n rtsec-workload

# Trigger 1: named crypto miner binary (Impact:Runtime/CryptoMinerExecuted, severity 8.0)
kubectl exec -n rtsec-workload deploy/rtsec-web -- sh -c "
  cp /bin/busybox /tmp/xmrig && chmod +x /tmp/xmrig
  /tmp/xmrig --help 2>/dev/null || true
"

# Trigger 2: fileless execution from shared memory (DefenseEvasion:Runtime/FilelessExecution, severity 5.0)
kubectl exec -n rtsec-workload deploy/rtsec-web -- sh -c "
  cp /bin/busybox /dev/shm/kworker && chmod +x /dev/shm/kworker
  /dev/shm/kworker ls / 2>/dev/null || true
"

# Trigger 3: service account token access (Execution:Runtime/SuspiciousCommand, severity 1.0)
kubectl exec -n rtsec-workload deploy/rtsec-web -- sh -c "
  cat /var/run/secrets/kubernetes.io/serviceaccount/token | head -c 20
"

kubectl apply -f /tmp/block-shell-exec.yaml
Wait 5 to 15 minutes. The agent batches events before analysis.
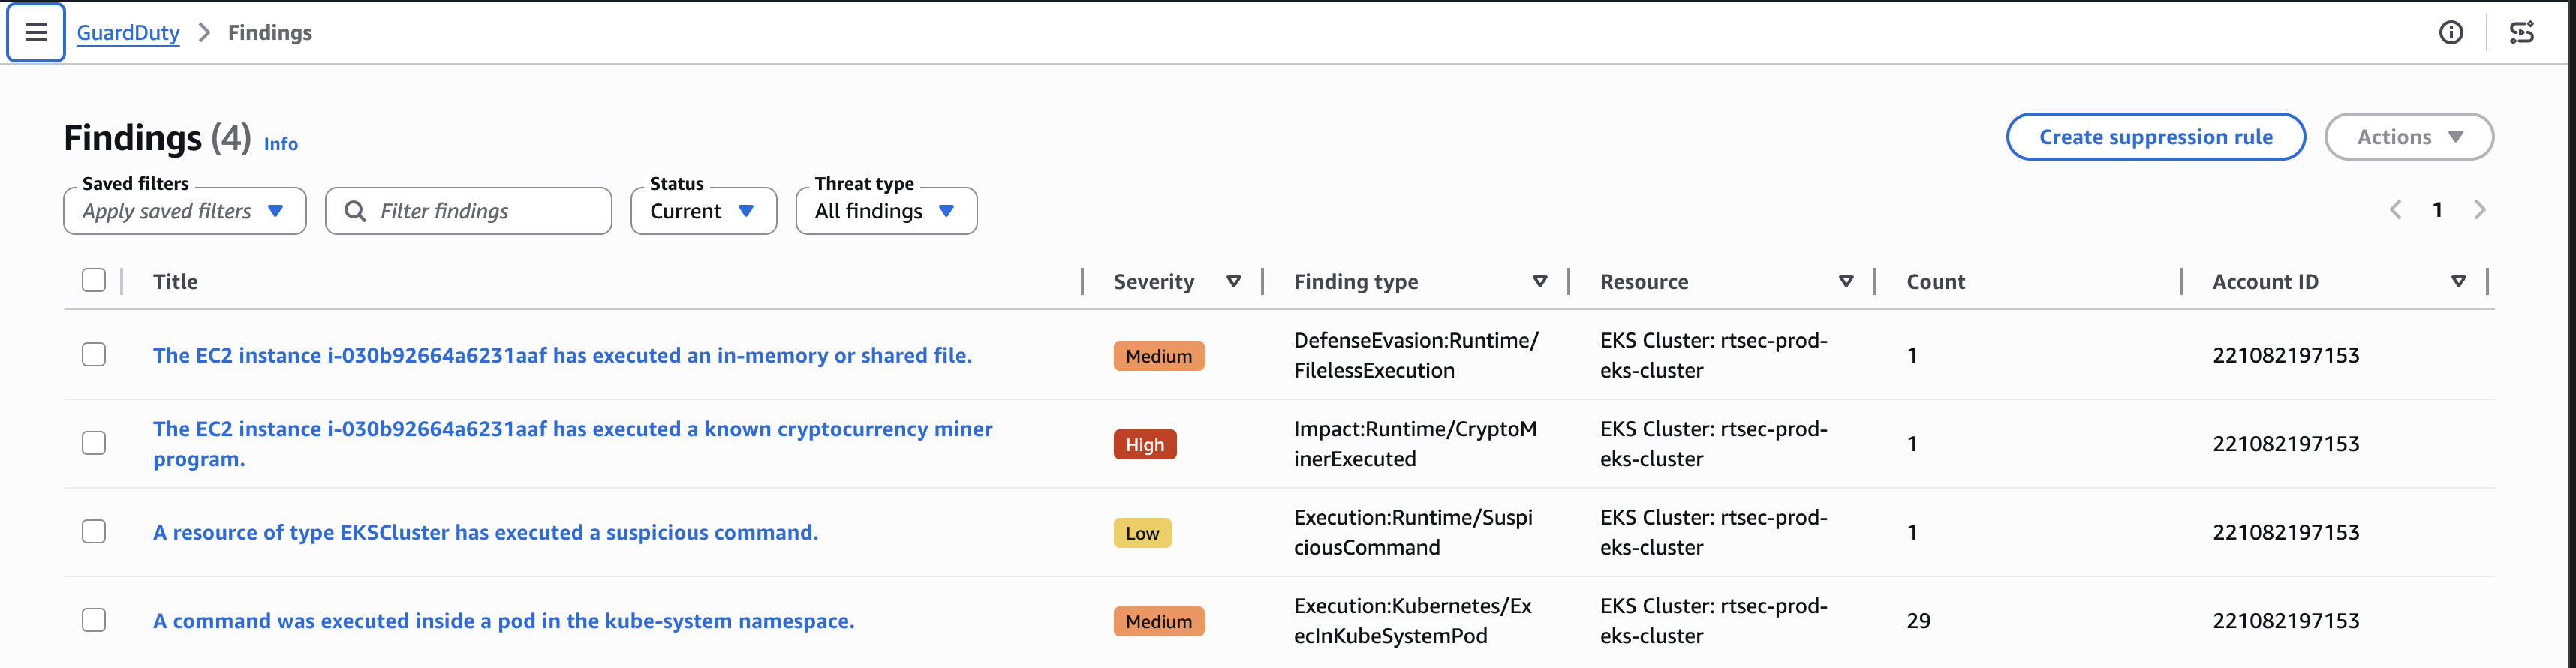
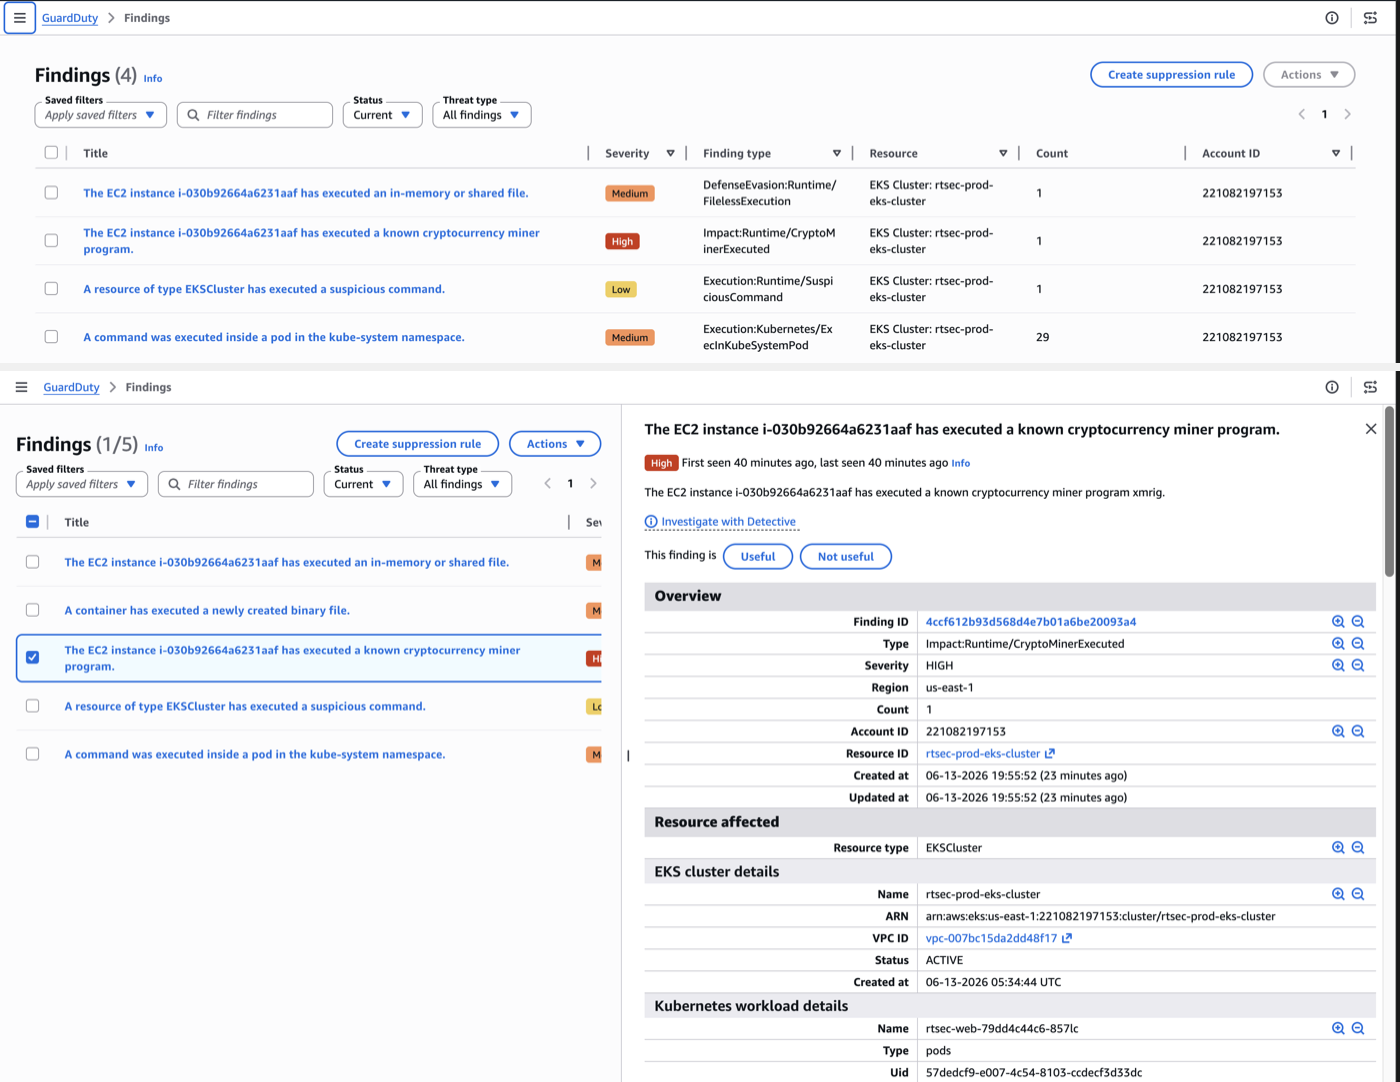
A fourth finding appeared that wasn’t deliberately triggered: Execution:Kubernetes/ExecInKubeSystemPod with count=29, from Phase 3. Every kubectl exec into a Tetragon pod in kube-system to run tetra tracingpolicy list got recorded as a finding. Exec into any kube-system pod generates this finding type. It is not a false positive: interactively execing into a kube-system pod is a real attack pattern. Running tetra commands directly during testing produces this same finding as a side effect.
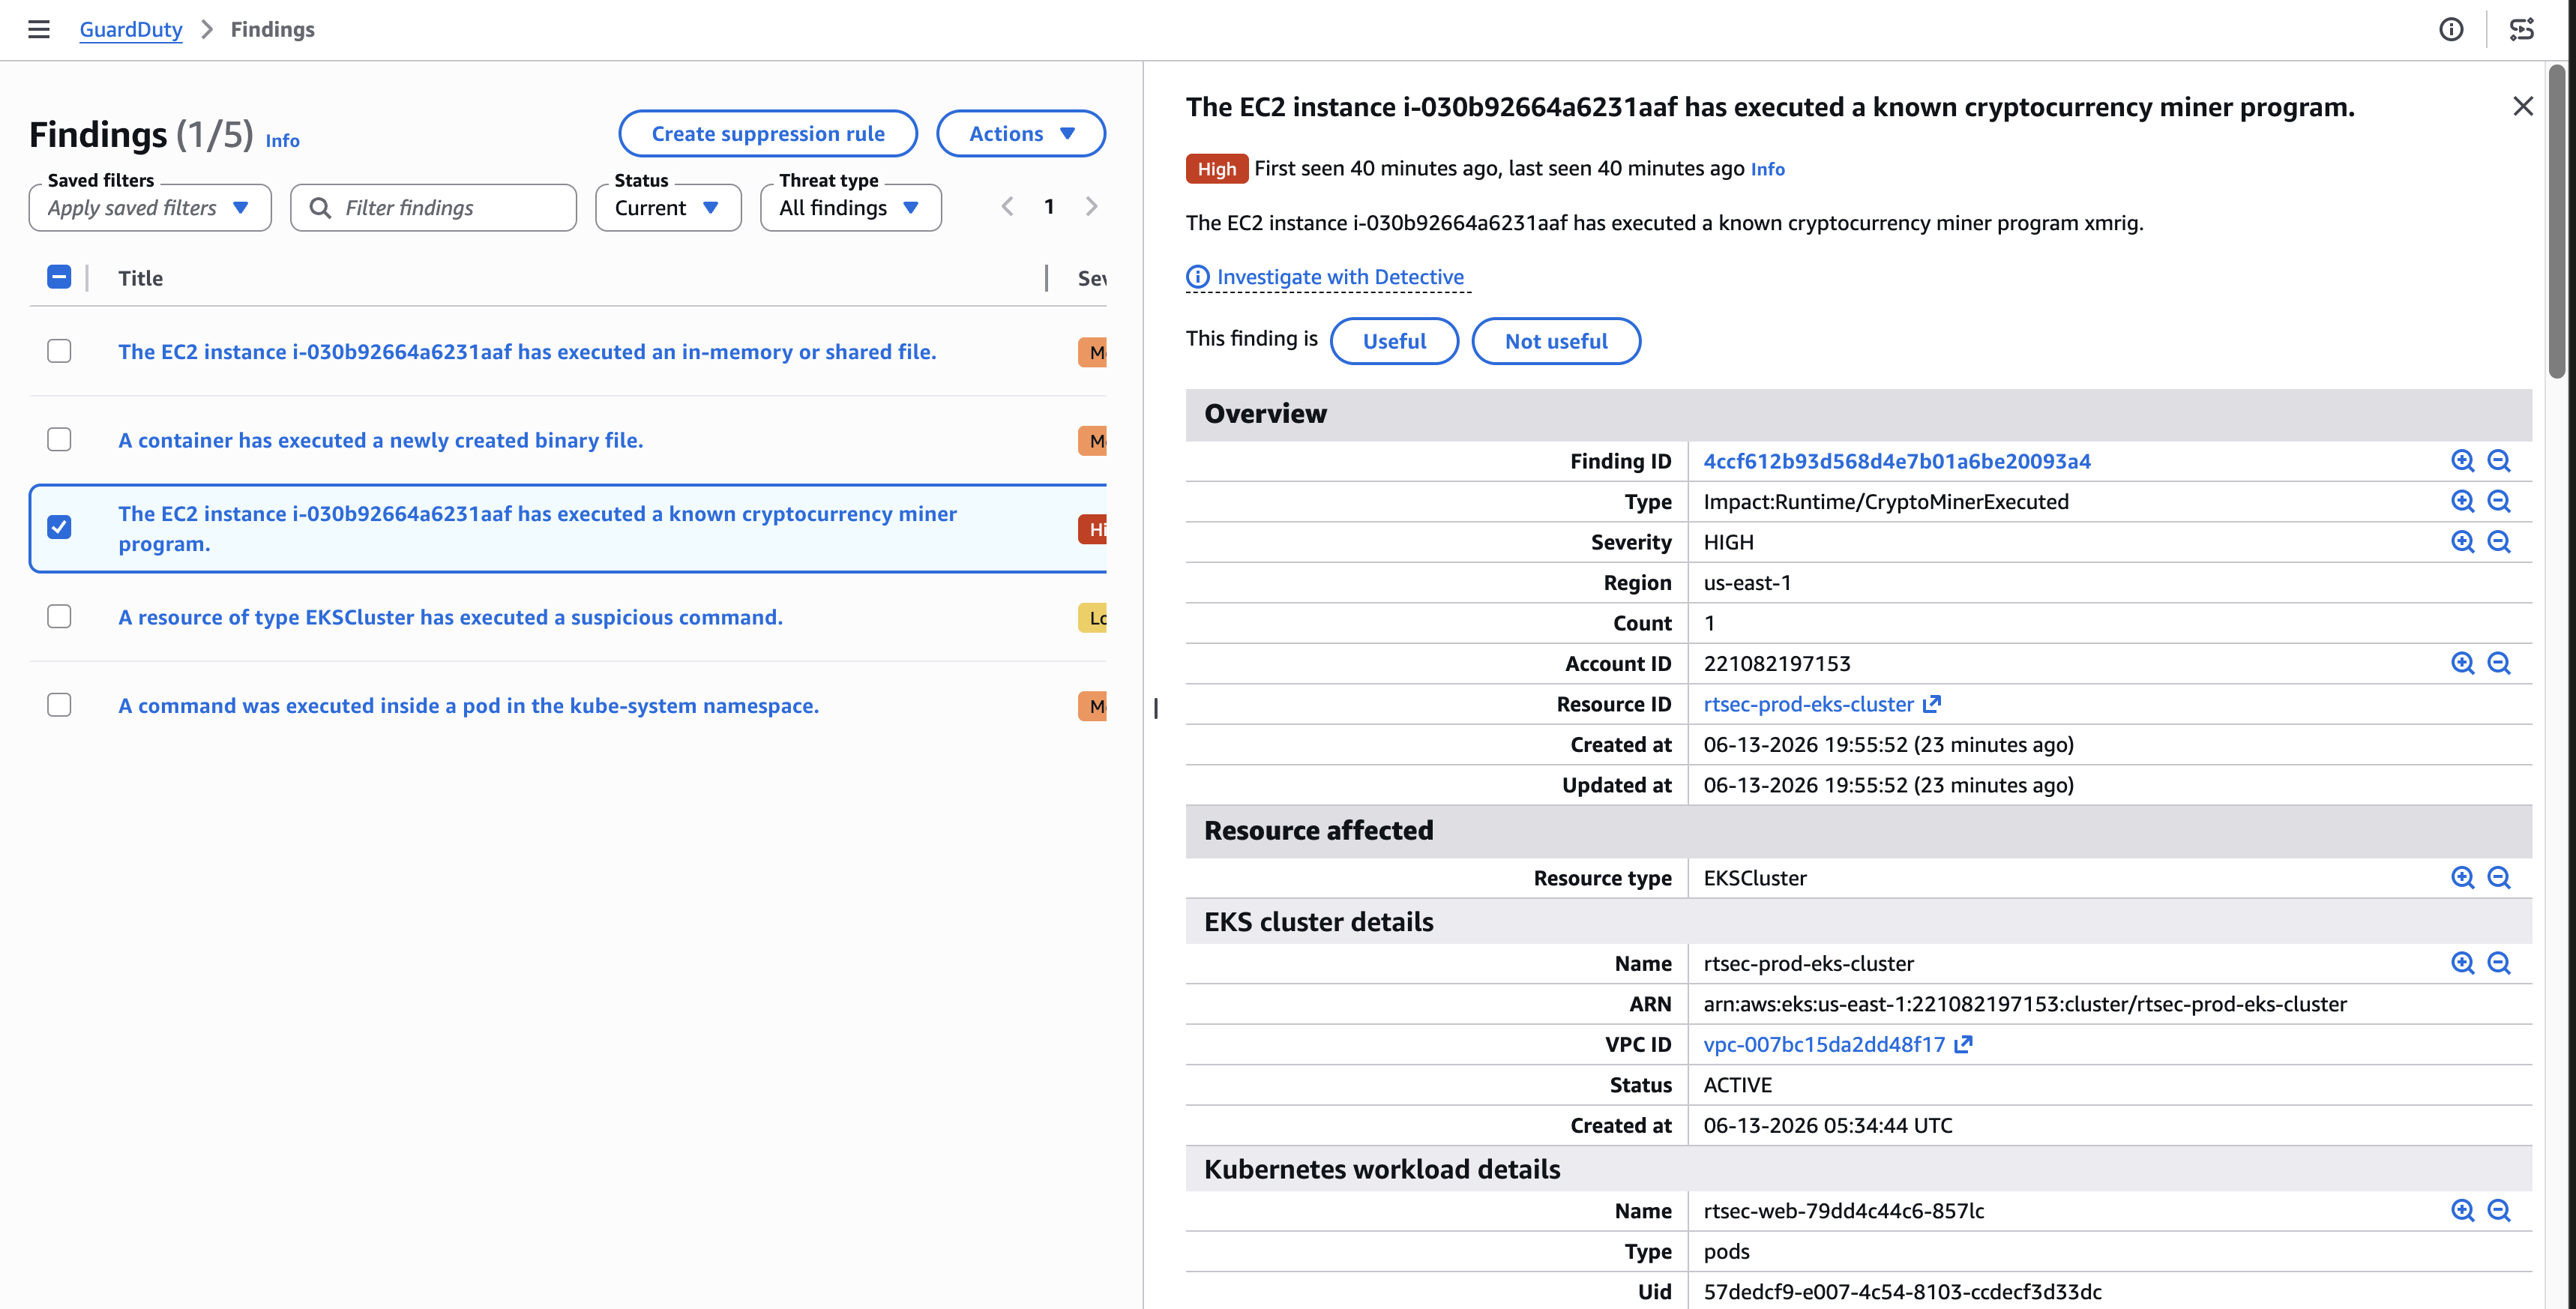
The crypto miner finding surfaces full Kubernetes context in GuardDuty: cluster name rtsec-prod-eks-cluster, workload rtsec-web, pod UID. GuardDuty records more than a raw kernel event on an EC2 instance: it correlates the kernel-level execution back through the container hierarchy to the Kubernetes workload, which makes the finding actionable.
The Security Difference
Before this project, the question was what happens if a container gets compromised. The answer: it depends on the attacker and whether any tool sees it.
After, in this tested configuration: a compromised container in rtsec-workload could not open /etc/shadow. The syscall did not complete: that’s enforcement, not just an alert. A shell could not spawn either; the execve was killed in-kernel before the shell process existed. These aren’t alerts, they’re enforcement results, measured via NENFORCE counters on the running policies.
Falco independently recorded the same events, giving a queryable alert history for everything attempted. GuardDuty surfaced the behavioural patterns (miner execution, fileless technique, token access) that only make sense with threat intelligence behind them.
The three layers answer three different questions. Tetragon answers “did this action complete?” Falco answers “what happened and when?” GuardDuty answers “does this match a known attack pattern?”
Where This Has Limits
These enforcement results are specific to this policy configuration, kernel version, and tool versions. They don’t generalise beyond what was tested.
The shell exec policy blocks sh, bash, and ash by executable path suffix. It doesn’t block execveat, direct syscalls without execve, statically-linked binaries with unexpected paths, or busybox applets invoked via an alias. The GuardDuty trigger section uses cp /bin/busybox /tmp/xmrig to sidestep the shell exec policy entirely and land a different finding. That’s deliberate: it demonstrates the gap directly. In production, name-based exec blocking is one layer in a stack, not a standalone control.
Falco rules fire on known bad patterns; novel behaviour that matches no rule produces no alert. GuardDuty findings are bounded by what AWS has modelled in its threat intelligence. Neither tool knows about application-specific attack surfaces.
Tetragon’s enforcement is only as strong as the policies written. An attacker operating entirely within what the policies permit (no shell, no /etc/shadow, no named miner binary) triggers none of the three layers here, which reflects the correct framing for any defence-in-depth stack rather than a tool flaw.
A few operational notes. The NENFORCE counter resets when the Tetragon DaemonSet restarts, so for a durable record, read the event log file inside the Tetragon pod directly. In this install, the path ended up doubled: /var/run/cilium/tetragon/var/run/cilium/tetragon/tetragon.log. That’s an artifact of how the exportFilename Helm value interacted with the install, not a guaranteed path, so check what yours produces. Scale the node group to zero between sessions to stop EC2 billing. The control plane keeps running at $0.10/hr, but node costs stop. Interface endpoints cost money even with instances stopped, so clean those up if you’re taking more than a day off between sessions.